Filing Flows › Consumer Discretionary › Whirlpool (WHR)
Whirlpool (WHR) earnings and revenue breakdown
Latest: Q3 2026 · 10-Q filed Oct 27, 2026 · Whirlpool (WHR) Q3 2026 earnings results →
Q3 2026 Revenue down 9% year over year to $3.7B · 6¢ of every $1 of revenue lost · operating margin 0.1%
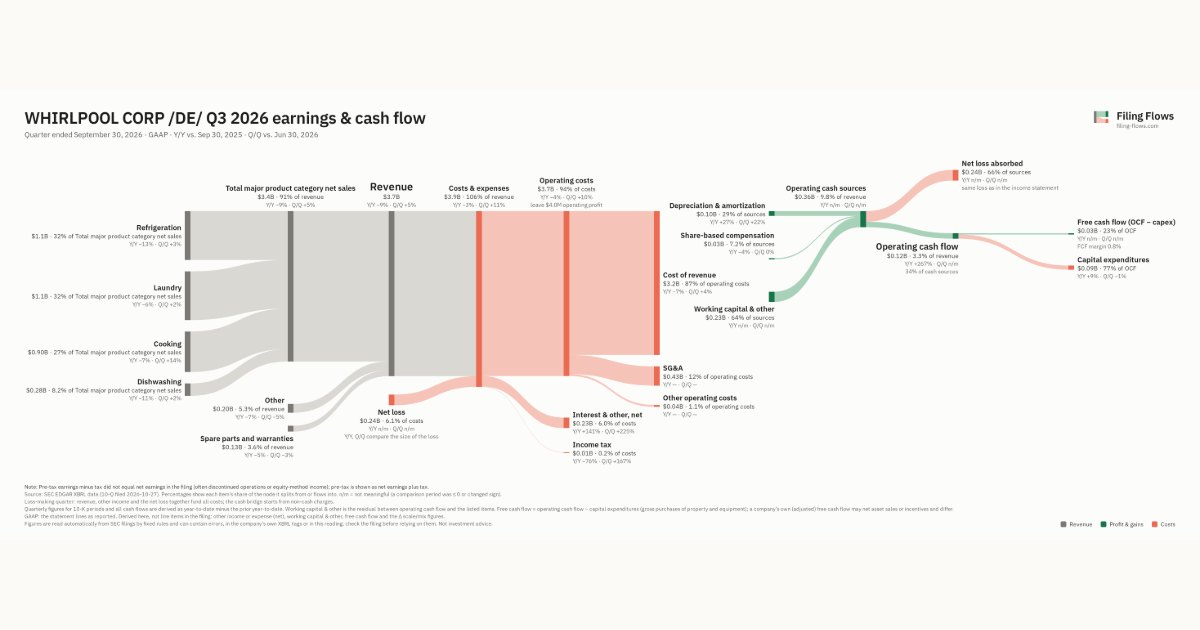
Whirlpool made $3.7B in Q3 2026 (-9% Y/Y): Total major product category net sales $3.4B, Other $195M, Spare parts and warranties $131M. Operating margin 0.1%, net loss $238M. See where every dollar goes — costs, profit and cash — as a Sankey from the 10-Q filed Oct 27, 2026.
Drawing the Sankey…
Open the interactive Sankey → click any line for what the company wrote about it, compare Y/Y and Q/Q, export as PNG or PDF
What changed this quarter
Revenue was $3.7B in Q3 2026, down 9% year over year and up 5% from the previous quarter. Refrigeration was the largest line at 30% of revenue. Refrigeration lost $0.16B year over year (down 13%), 46% of the total change.
Gross margin was 12.9%, down 1.9 points from Q3 2025. Operating profit was $4.0M, a 0.1% margin (down 5.0 points year over year). Operating expenses grew 21% against a revenue fall of 9%. The quarter ended with a net loss of $0.24B, after a profit of $0.09B the previous quarter. Net interest and other expense of $0.23B was the main reason.
Operating cash flow was $0.12B (up 267% year over year). Non-cash charges added back $0.10B of depreciation and amortization and $0.03B of share-based compensation. Working capital and other items added $0.23B. Capital expenditures of $0.09B left free cash flow of $0.03B.
Quarterly history
| Quarter | Form | Filed | Revenue | Y/Y | Op. margin | Net earnings | Op. cash flow |
|---|---|---|---|---|---|---|---|
| Q3 2026 | 10-Q | Oct 27, 2026 | $3.7B | -9% | 0.1% | −$238M | $121M |
| Q2 2026 | 10-Q | Aug 4, 2026 | $3.5B | -7% | 4.6% | $88.0M | −$120M |
| Q1 2026 | 10-Q | May 7, 2026 | $3.3B | -10% | 0.5% | −$82.0M | −$827M |
| Q4 2025 | 10-K | Feb 11, 2026 | $4.1B | -0.9% | 5.9% | $112M | $1.1B |
| Q3 2025 | 10-Q | Oct 28, 2025 | $4.0B | +1% | 5.1% | $73.0M | $33.0M |
| Q2 2025 | 10-Q | Jul 29, 2025 | $3.8B | -5% | 5.4% | $65.0M | $19.0M |
| Q1 2025 | 10-Q | Apr 24, 2025 | $3.6B | -19% | 5.1% | $71.0M | −$721M |
Charts
Interactive views
The same charts as the app — open one to draw it.
💵Where each $1 goesinteractive
Loading the interactive chart…
🌏Named in Asian annual reportsinteractive
Loading the interactive chart…
🔄Rotation against the market and its industry (RRG)interactive
Loading the interactive chart…
🔍Earnings qualityinteractive
Loading the interactive chart…
⚖️Fair value by methodinteractive
Loading the interactive chart…
🔭Outlook & guidanceinteractive
Loading the interactive chart…
📈Investments: gains and what it boughtinteractive
Loading the interactive chart…
🏭Its industry’s money flow (input-output)interactive
Loading the interactive chart…
Customers and suppliers named in filings
Sells to
Buys from
About Whirlpool
Whirlpool Corporation (NYSE: WHR) is a leading home appliance company, in constant pursuit of improving life at home. As the only major U.S.-based manufacturer of kitchen and laundry appliances, the company is driving meaningful innovation to meet the evolving needs of consumers through its iconic brand portfolio, including Whirlpool, KitchenAid, JennAir, Maytag, Amana, Brastemp, Consul, and InSinkErato r. In 2025, the company reported approximately $16 billion in annual net sales - close to 90% of which were in the Americas - 41,000 employees and 35 manufacturing and technology research centers. Additional information about the company can be found at WhirlpoolCorp.com.
In its own words, from its 8-K, filed Aug 3, 2026.
Whirlpool against its Household Appliances peers
The largest companies of the same SEC industry, each at its latest quarter. Revenue growth: -9% against the peers' median -0.2%. Operating margin: 0.1% against the peers' median 0.1%.
| Company | Quarter | Revenue | Y/Y | Op. margin |
|---|---|---|---|---|
| WHR Whirlpool | Q3 2026 | $3.7B | -9% | 0.1% |
| SN SharkNinja | Q3 2026 | $2.0B | +21% | 22.4% |
| AOS Smith A O | Q3 2026 | $940M | -0.2% | 18.5% |
| COOK Traeger | Q3 2026 | $74.7M | -40% | -26.5% |
| TKLS Trutankless | Q2 2026 | $539K | +470% | -423.8% |
Source: Whirlpool 10-Q on SEC EDGAR · CIK 106640 · Household Appliances
13F: who owns WHR and who is buying
More on WHR
History
Every quarter: Q3 2026 results · Q2 2026 results · Q1 2026 results · Q4 2025 results · Q3 2025 results · Q2 2025 results · Q1 2025 results
- Whirlpool guidance history: guided vs reported
- Whirlpool gross margin by quarter
- Whirlpool operating margin by quarter
- Whirlpool net income by quarter
- Whirlpool capital expenditures by quarter
- Whirlpool Total major product category net sales revenue by quarter
- Whirlpool Spare parts and warranties revenue by quarter