Filing Flows › Industrials › Snap-on (SNA)
Snap-on (SNA) earnings and revenue breakdown
Latest: Q3 2026 · 10-Q filed Oct 22, 2026 · Snap-on (SNA) Q3 2026 earnings results →
Q3 2026 Revenue down 1% year over year to $1.3B · 19¢ of every $1 of revenue kept as net profit · operating margin 24.7%
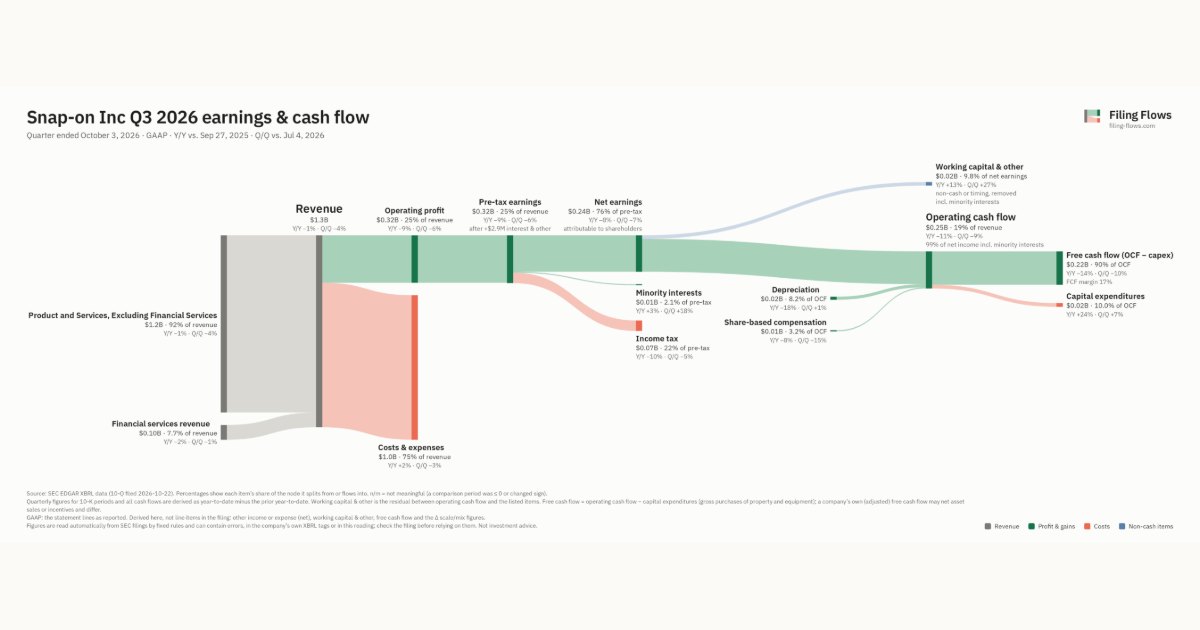
Snap-on made $1.3B in Q3 2026 (-0.7% Y/Y): Product and Services, Excluding Financial Services $1.2B, Financial services revenue $98.6M. Operating margin 24.7%, net earnings $243M. See where every dollar goes — costs, profit and cash — as a Sankey from the 10-Q filed Oct 22, 2026.
Drawing the Sankey…
Open the interactive Sankey → click any line for what the company wrote about it, compare Y/Y and Q/Q, export as PNG or PDF
What changed this quarter
Revenue was $1.3B in Q3 2026, down 1% year over year and down 4% from the previous quarter. Product and Services, Excluding Financial Services was the largest line at 92% of revenue. Product and Services, Excluding Financial Services lost $0.01B year over year (down 1%), 74% of the total change.
Operating profit was $0.32B, a 24.7% margin (down 2.2 points year over year). Total costs grew 2% against a revenue fall of 1%. Net earnings were $0.24B, down 8% year over year. The effective tax rate was 21.8%.
Operating cash flow was $0.25B (down 11% year over year), 99% of net income including minority interests. Non-cash charges added back $0.02B of depreciation and $0.01B of share-based compensation. Working capital and other items used $0.03B. Capital expenditures of $0.02B left free cash flow of $0.22B.
Quarterly history
| Quarter | Form | Filed | Revenue | Y/Y | Op. margin | Net earnings | Op. cash flow |
|---|---|---|---|---|---|---|---|
| Q3 2026 | 10-Q | Oct 22, 2026 | $1.3B | -0.7% | 24.7% | $243M | $248M |
| Q2 2026 | 10-Q | Jul 23, 2026 | $1.3B | +4% | 25.2% | $261M | $272M |
| Q1 2026 | 10-Q | Apr 23, 2026 | $1.3B | +5% | 24.4% | $247M | $369M |
| Q4 2025 | 10-K | Feb 12, 2026 | $1.3B | +3% | 25.3% | $261M | $268M |
| Q3 2025 | 10-Q | Oct 16, 2025 | $1.3B | +4% | 26.9% | $265M | $278M |
| Q2 2025 | 10-Q | Jul 17, 2025 | $1.3B | +0.1% | 25.5% | $250M | $237M |
| Q1 2025 | 10-Q | Apr 17, 2025 | $1.2B | -3% | 25.2% | $240M | $298M |
Charts
Interactive views
The same charts as the app — open one to draw it.
💵Where each $1 goesinteractive
Loading the interactive chart…
🌏Named in Asian annual reportsinteractive
Loading the interactive chart…
🔄Rotation against the market and its industry (RRG)interactive
Loading the interactive chart…
🔍Earnings qualityinteractive
Loading the interactive chart…
⚖️Fair value by methodinteractive
Loading the interactive chart…
🔭Outlook & guidanceinteractive
Loading the interactive chart…
📈Investments: gains and what it boughtinteractive
Loading the interactive chart…
🏭Its industry’s money flow (input-output)interactive
Loading the interactive chart…
About Snap-on
Snap-on is a leading global innovator, manufacturer and marketer of tools, equipment, diagnostics, repair information and systems solutions for professional users performing critical tasks including those working in vehicle repair, aerospace, the military, natural resources, and manufacturing. From its founding in 1920, Snap-on has been recognized as the mark of the serious and the outward sign of the pride and dignity working men and women take in their professions. Products and services are sold through the company’s network of widely recognized franchisee vans as well as through direct and distributor channels, under a variety of notable brands. The company also provides financing programs to facilitate the sales of its products and to support its franchise business.
In its own words, from its 10-K, filed Feb 12, 2026.
Snap-on against its Cutlery, Handtools & General Hardware peers
The largest companies of the same SEC industry, each at its latest quarter. Revenue growth: -0.7% against the peers' median +3%. Operating margin: 24.7% against the peers' median 9.6%.
| Company | Quarter | Revenue | Y/Y | Op. margin |
|---|---|---|---|---|
| SNA Snap-on | Q3 2026 | $1.3B | -0.7% | 24.7% |
| SWK Stanley Black & Decker | Q3 2026 | $3.7B | -0.6% | 9.6% |
| SSD Simpson Manufacturing | Q3 2026 | $638M | +2% | 22.1% |
| HLMN Hillman Solutions | Q3 2026 | $457M | +8% | 8.3% |
| LCUT Lifetime Brands | Q3 2026 | $178M | +3% | 0.0% |
| EML Eastern | Q2 2026 | $61.8M | -12% | 2.7% |
| ACU Acme United | Q3 2026 | $58.0M | +18% | 7.7% |
| CIX Compx International | Q3 2026 | $44.0M | +10% | 14.5% |
Source: Snap-on 10-Q on SEC EDGAR · CIK 91440 · Cutlery, Handtools & General Hardware
Guidance and outlook
13F: who owns SNA and who is buying
More on SNA
History
Every quarter: Q3 2026 results · Q2 2026 results · Q1 2026 results · Q4 2025 results · Q3 2025 results · Q2 2025 results · Q1 2025 results
- Snap-on guidance history: guided vs reported
- Snap-on operating margin by quarter
- Snap-on net income by quarter
- Snap-on free cash flow by quarter
- Snap-on capital expenditures by quarter
- Snap-on Product and Services, Excluding Financial Services revenue by quarter
- Snap-on Financial services revenue revenue by quarter