Filing Flows › Health Care › Zimmer Biomet Holdings (ZBH)
Zimmer Biomet Holdings (ZBH) earnings and revenue breakdown
Latest: Q3 2026 · 10-Q filed Nov 4, 2026 · Zimmer Biomet Holdings (ZBH) Q3 2026 earnings results →
Q3 2026 Revenue up 3% year over year to $2.1B · 9¢ of every $1 of revenue kept as net profit · operating margin 14.9%
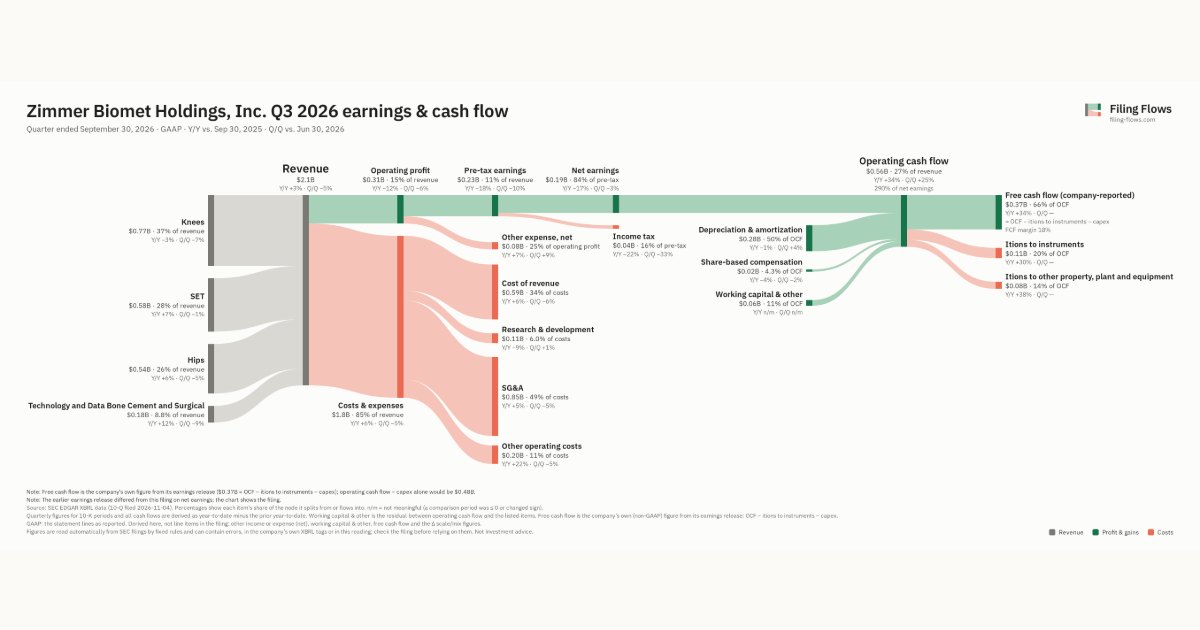
Zimmer Biomet Holdings made $2.1B in Q3 2026 (+3% Y/Y): Knees $768M, SET $578M, Hips $536M. Operating margin 14.9%, net earnings $193M. See where every dollar goes — costs, profit and cash — as a Sankey from the 10-Q filed Nov 4, 2026.
Drawing the Sankey…
Open the interactive Sankey → click any line for what the company wrote about it, compare Y/Y and Q/Q, export as PNG or PDF
What changed this quarter
Revenue was $2.1B in Q3 2026, up 3% year over year and down 5% from the previous quarter. Knees was the largest line at 37% of revenue. SET added $0.04B year over year (up 7%), 60% of the total change. Knees declined 3%.
Operating profit was $0.31B, a 14.9% margin (down 2.6 points year over year). Operating profit fell $0.04B even though revenue rose $0.06B versus Q3 2025, so costs grew faster than sales. Total costs grew 6% against revenue growth of 3%. The fastest-growing cost line was Other operating costs (+22%). Net earnings were $0.19B, down 17% year over year. The effective tax rate was 16.2%.
Operating cash flow was $0.56B (up 34% year over year), 290% of net earnings. Non-cash charges added back $0.28B of depreciation and amortization and $0.02B of share-based compensation. Working capital and other items added $0.06B. After itions to instruments ($0.11B) and itions to other property, plant and equipment ($0.08B), free cash flow as the company reports it was $0.37B.
Quarterly history
| Quarter | Form | Filed | Revenue | Y/Y | Op. margin | Net earnings | Op. cash flow |
|---|---|---|---|---|---|---|---|
| Q3 2026 | 10-Q | Nov 4, 2026 | $2.1B | +3% | 14.9% | $193M | $560M |
| Q2 2026 | 10-Q | Aug 5, 2026 | $2.2B | +5% | 15.0% | $200M | $448M |
| Q1 2026 | 10-Q | May 1, 2026 | $2.1B | +9% | 17.9% | $238M | $359M |
| Q4 2025 | 10-K | Feb 20, 2026 | $2.2B | +11% | 6.9% | $138M | $517M |
| Q3 2025 | 10-Q | Nov 5, 2025 | $2.0B | +10% | 17.6% | $231M | $419M |
| Q2 2025 | 10-Q | Aug 7, 2025 | $2.1B | +7% | 14.4% | $153M | $378M |
| Q1 2025 | 10-Q | May 5, 2025 | $1.9B | +1% | 15.3% | $183M | $383M |
Charts
Interactive views
The same charts as the app — open one to draw it.
💵Where each $1 goesinteractive
Loading the interactive chart…
🌏Named in Asian annual reportsinteractive
Loading the interactive chart…
🔄Rotation against the market and its industry (RRG)interactive
Loading the interactive chart…
🔍Earnings qualityinteractive
Loading the interactive chart…
⚖️Fair value by methodinteractive
Loading the interactive chart…
🔭Outlook & guidanceinteractive
Loading the interactive chart…
📈Investments: gains and what it boughtinteractive
Loading the interactive chart…
🏭Its industry’s money flow (input-output)interactive
Loading the interactive chart…
About Zimmer Biomet Holdings
Zimmer Biomet is a global medical technology leader with a comprehensive portfolio designed to maximize mobility and improve health. We seamlessly transform the patient experience through our innovative products and suite of integrated digital and robotic technologies that leverage data, data analytics and artificial intelligence. With 90+ years of trusted leadership and proven expertise, Zimmer Biomet is positioned to deliver the highest quality solutions to patients and providers. Our legacy continues to come to life today through our progressive culture of evolution and innovation.
In its own words, from its 8-K, filed Aug 5, 2026.
Zimmer Biomet Holdings against its Orthopedic, Prosthetic & Surgical Appliances & Supplies peers
The largest companies of the same SEC industry, each at its latest quarter. Revenue growth: +3% against the peers' median +9%. Operating margin: 14.9% against the peers' median 16.4%.
| Company | Quarter | Revenue | Y/Y | Op. margin |
|---|---|---|---|---|
| ZBH Zimmer Biomet Holdings | Q3 2026 | $2.1B | +3% | 14.9% |
| ISRG Intuitive Surgical | Q3 2026 | $3.0B | +22% | 19.4% |
| EW Edwards Lifesciences | Q3 2026 | $1.7B | +10% | 17.4% |
| STE Steris | Q2 FY27 | $1.6B | +9% | 18.5% |
| ALGN Align Technology | Q3 2026 | $1.0B | +2% | 16.7% |
| ENOV Enovis | Q3 2026 | $559M | +2% | 0.6% |
| MSA MSA Safety | Q3 2026 | $536M | +14% | 16.4% |
| CDRE Cadre Holdings | Q3 2026 | $203M | +30% | 14.0% |
| INGN Inogen | Q2 2026 | $95.1M | +3% | -5.4% |
Source: Zimmer Biomet Holdings 10-Q on SEC EDGAR · CIK 1136869 · Orthopedic, Prosthetic & Surgical Appliances & Supplies
13F: who owns ZBH and who is buying
More on ZBH
- How Zimmer Biomet Holdings makes money: revenue by segment
- Zimmer Biomet Holdings next earnings date and what analysts expect
- Zimmer Biomet Holdings stock forecast, price target and fair value
- Who owns Zimmer Biomet Holdings stock: holders, funds and Congress trades
- Zimmer Biomet Holdings guidance and outlook
- Is Zimmer Biomet Holdings a takeover target? LBO and rumors
- Zimmer Biomet Holdings recalls, complaints and regulation
History
Every quarter: Q3 2026 results · Q2 2026 results · Q1 2026 results · Q4 2025 results · Q3 2025 results · Q2 2025 results · Q1 2025 results
- Zimmer Biomet Holdings guidance history: guided vs reported
- Zimmer Biomet Holdings operating margin by quarter
- Zimmer Biomet Holdings net income by quarter
- Zimmer Biomet Holdings free cash flow by quarter
- Zimmer Biomet Holdings R&D spending by quarter
- Zimmer Biomet Holdings Knees revenue by quarter
- Zimmer Biomet Holdings SET revenue by quarter
- Zimmer Biomet Holdings Hips revenue by quarter