Filing Flows › Health Care › Steris (STE)
Steris (STE) earnings and revenue breakdown
Latest: Q2 FY27 · 10-Q filed Nov 5, 2026 · Steris (STE) Q2 FY27 earnings results →
Q2 FY27 Revenue up 9% year over year to $1.6B · 13¢ of every $1 of revenue kept as net profit · operating margin 18.5%
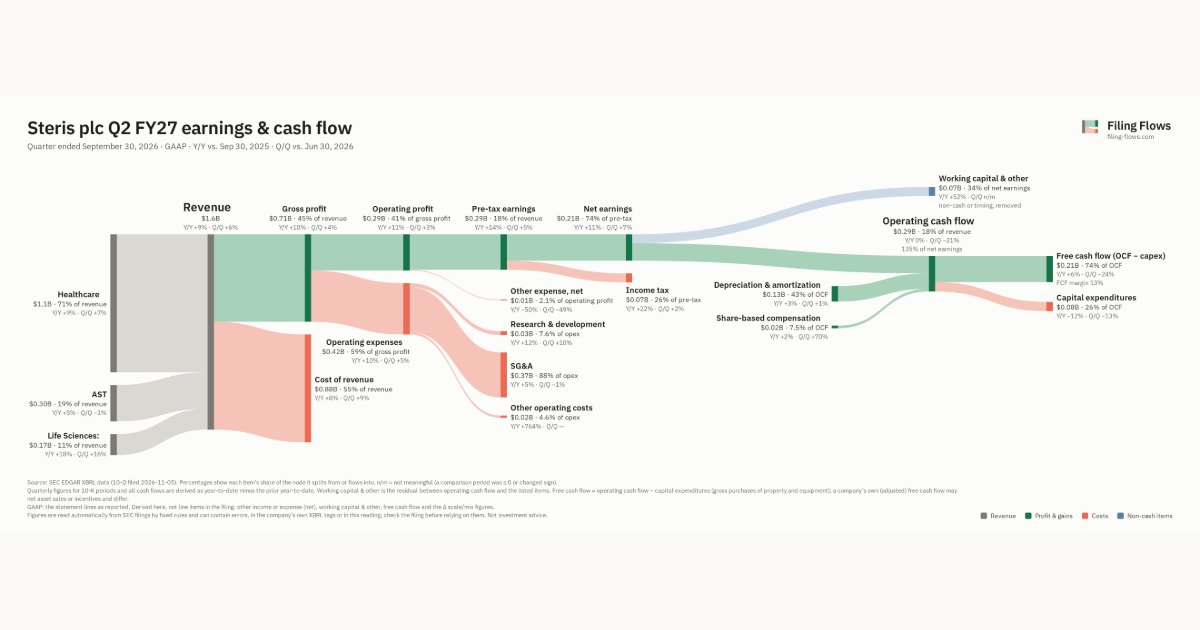
Steris made $1.6B in Q2 FY27 (+9% Y/Y): Healthcare $1.1B, AST $296M, Life Sciences: $171M. Operating margin 18.5%, net earnings $214M. See where every dollar goes — costs, profit and cash — as a Sankey from the 10-Q filed Nov 5, 2026.
Drawing the Sankey…
Open the interactive Sankey → click any line for what the company wrote about it, compare Y/Y and Q/Q, export as PNG or PDF
What changed this quarter
Revenue was $1.6B in Q2 FY27, up 9% year over year and up 6% from the previous quarter. Healthcare was the largest line at 71% of revenue. Healthcare added $0.09B year over year (up 9%), 69% of the total change.
Gross margin was 44.7%, up 0.5 points from Q2 FY26. Operating profit was $0.29B, a 18.5% margin (up 0.3 points year over year). Of the extra revenue versus Q2 FY26, 22% reached operating profit, above the 18% margin then. Operating expenses grew 10% against revenue growth of 9%. The fastest-growing cost line was Other operating costs (+764%). Net earnings were $0.21B, up 11% year over year. The effective tax rate was 25.7%.
Operating cash flow was $0.29B (roughly flat year over year), 135% of net earnings. Non-cash charges added back $0.13B of depreciation and amortization and $0.02B of share-based compensation. Working capital and other items used $0.07B. Capital expenditures of $0.08B left free cash flow of $0.21B.
Quarterly history
| Quarter | Form | Filed | Revenue | Y/Y | Op. margin | Net earnings | Op. cash flow |
|---|---|---|---|---|---|---|---|
| Q2 FY27 | 10-Q | Nov 5, 2026 | $1.6B | +9% | 18.5% | $214M | $289M |
| Q1 FY27 | 10-Q | Aug 7, 2026 | $1.5B | +7% | 19.1% | $201M | $367M |
| Q4 FY26 | 10-K | May 29, 2026 | $1.6B | +7% | 19.9% | $220M | $335M |
| Q3 FY26 | 10-Q | Feb 6, 2026 | $1.5B | +9% | 18.3% | $194M | $298M |
| Q2 FY26 | 10-Q | Nov 6, 2025 | $1.5B | +10% | 18.2% | $192M | $288M |
| Q1 FY26 | 10-Q | Aug 7, 2025 | $1.4B | +9% | 17.7% | $178M | $420M |
| Q4 FY25 | 10-K | May 29, 2025 | $1.5B | +4% | 14.6% | $146M | $261M |
Charts
Interactive views
The same charts as the app — open one to draw it.
💵Where each $1 goesinteractive
Loading the interactive chart…
🌏Named in Asian annual reportsinteractive
Loading the interactive chart…
🔄Rotation against the market and its industry (RRG)interactive
Loading the interactive chart…
🔍Earnings qualityinteractive
Loading the interactive chart…
⚖️Fair value by methodinteractive
Loading the interactive chart…
🔭Outlook & guidanceinteractive
Loading the interactive chart…
📈Investments: gains and what it boughtinteractive
Loading the interactive chart…
🏭Its industry’s money flow (input-output)interactive
Loading the interactive chart…
About Steris
STERIS is a leading global provider of products and services that support patient care with an emphasis on infection prevention. WE HELP OUR CUSTOMERS CREATE A HEALTHIER AND SAFER WORLD by providing innovative healthcare and life science products and services around the globe. We offer our Customers a unique mix of innovative products and services. These include: consumable products, such as detergents, endoscopy accessories, barrier products, instruments and tools; services, including equipment installation and maintenance, microbial reduction of medical devices, instrument and scope repair, laboratory testing, and outsourced reprocessing; capital equipment, such as sterilizers, surgical tables, and automated endoscope reprocessors; and connectivity solutions such as operating room (“OR”) integrati on.
In its own words, from its 10-K, filed May 29, 2026.
Steris against its Orthopedic, Prosthetic & Surgical Appliances & Supplies peers
The largest companies of the same SEC industry, each at its latest quarter. Revenue growth: +9% against the peers' median +9%. Operating margin: 18.5% against the peers' median 16.4%.
| Company | Quarter | Revenue | Y/Y | Op. margin |
|---|---|---|---|---|
| STE Steris | Q2 FY27 | $1.6B | +9% | 18.5% |
| ISRG Intuitive Surgical | Q3 2026 | $3.0B | +22% | 19.4% |
| ZBH Zimmer Biomet Holdings | Q3 2026 | $2.1B | +3% | 14.9% |
| EW Edwards Lifesciences | Q3 2026 | $1.7B | +10% | 17.4% |
| ALGN Align Technology | Q3 2026 | $1.0B | +2% | 16.7% |
| ENOV Enovis | Q3 2026 | $559M | +2% | 0.6% |
| MSA MSA Safety | Q3 2026 | $536M | +14% | 16.4% |
| CDRE Cadre Holdings | Q3 2026 | $203M | +30% | 14.0% |
| INGN Inogen | Q2 2026 | $95.1M | +3% | -5.4% |
Source: Steris 10-Q on SEC EDGAR · CIK 1757898 · Orthopedic, Prosthetic & Surgical Appliances & Supplies
Guidance and outlook
More on STE
- How Steris makes money: revenue by segment
- Steris next earnings date and what analysts expect
- Steris stock forecast, price target and fair value
- Who owns Steris stock: holders, funds and Congress trades
- Steris guidance and outlook
- Is Steris a takeover target? LBO and rumors
- Steris recalls, complaints and regulation
History
Every quarter: Q2 FY27 results · Q1 FY27 results · Q4 FY26 results · Q3 FY26 results · Q2 FY26 results · Q1 FY26 results · Q4 FY25 results
- Steris guidance history: guided vs reported
- Steris gross margin by quarter
- Steris operating margin by quarter
- Steris net income by quarter
- Steris free cash flow by quarter
- Steris R&D spending by quarter
- Steris capital expenditures by quarter
- Steris Healthcare revenue by quarter
- Steris AST revenue by quarter
- Steris Life Sciences: revenue by quarter