Filing Flows › Consumer Discretionary › Advance Auto Parts (AAP)
Advance Auto Parts (AAP) earnings and revenue breakdown
Latest: Q3 2026 · 10-Q filed Nov 5, 2026 · Advance Auto Parts (AAP) Q3 2026 earnings results →
Q3 2026 Revenue down 1% year over year to $2.0B · 1¢ of every $1 of revenue kept as net profit · operating margin 2.3%
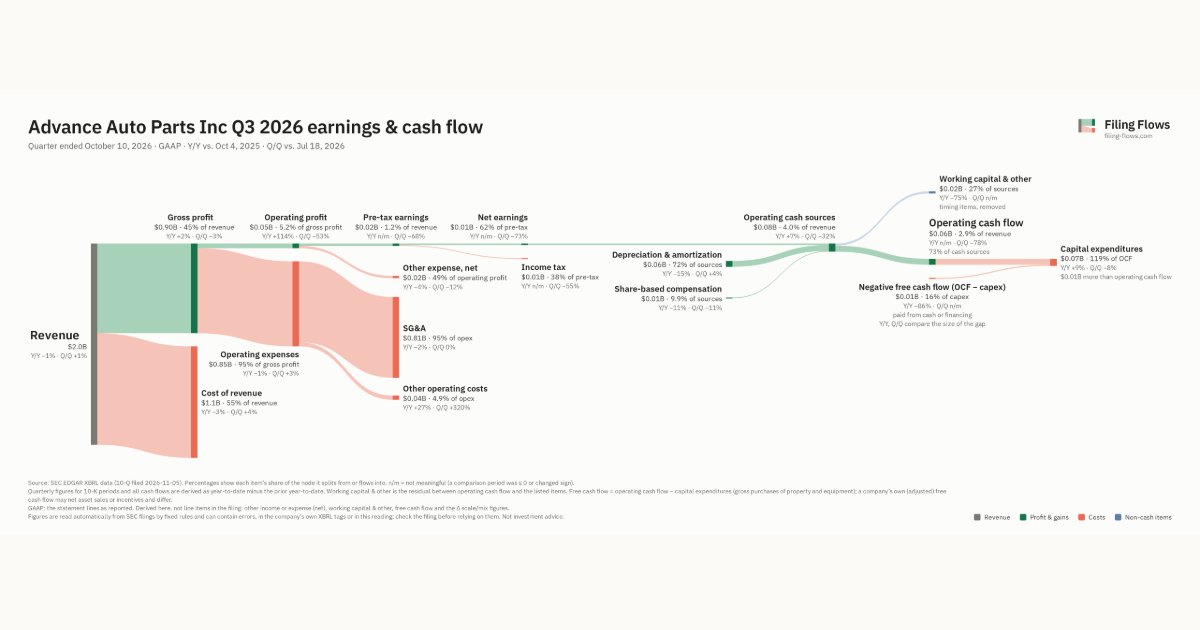
Advance Auto Parts made $2.0B in Q3 2026 (-1% Y/Y). Operating margin 2.3%, net earnings $15.0M. See where every dollar goes — costs, profit and cash — as a Sankey from the 10-Q filed Nov 5, 2026.
Drawing the Sankey…
Open the interactive Sankey → click any line for what the company wrote about it, compare Y/Y and Q/Q, export as PNG or PDF
What changed this quarter
Revenue was $2.0B in Q3 2026, down 1% year over year and up 1% from the previous quarter.
Gross margin was 44.6%, up 1.3 points from Q3 2025. Operating profit was $0.05B, a 2.3% margin (up 1.3 points year over year). Operating expenses fell 1% while revenue fell 1%. The fastest-growing cost line was Other operating costs (+27%). Net earnings were $0.01B. The effective tax rate was 37.5%.
Operating cash flow was $0.06B, 393% of net earnings. Non-cash charges added back $0.06B of depreciation and amortization and $0.01B of share-based compensation. Working capital and other items used $0.02B. Capital expenditures of $0.07B exceeded it, leaving free cash flow of −$0.01B.
Quarterly history
| Quarter | Form | Filed | Revenue | Y/Y | Op. margin | Net earnings | Op. cash flow |
|---|---|---|---|---|---|---|---|
| Q3 2026 | 10-Q | Nov 5, 2026 | $2.0B | -1% | 2.3% | $15.0M | $59.0M |
| Q2 2026 | 10-Q | Aug 20, 2026 | $2.0B | -0.5% | 5.1% | $55.0M | $271M |
| Q4 2025 | 10-K | Feb 13, 2026 | $2.0B | -1% | 2.2% | $6.0M | $72.0M |
| Q3 2025 | 10-Q | Oct 30, 2025 | $2.0B | -5% | 1.1% | −$1.0M | −$12.0M |
| Q2 2025 | 10-Q | Aug 14, 2025 | $2.0B | -8% | 1.1% | $15.0M | $50.0M |
| Q4 2024 | 10-K | Feb 26, 2025 | $2.0B | -51% | -41.1% | −$415M | −$73.0M |
Charts
Interactive views
The same charts as the app — open one to draw it.
💵Where each $1 goesinteractive
Loading the interactive chart…
🌏Named in Asian annual reportsinteractive
Loading the interactive chart…
🔄Rotation against the market and its industry (RRG)interactive
Loading the interactive chart…
🔍Earnings qualityinteractive
Loading the interactive chart…
⚖️Fair value by methodinteractive
Loading the interactive chart…
🔭Outlook & guidanceinteractive
Loading the interactive chart…
📈Investments: gains and what it boughtinteractive
Loading the interactive chart…
🏭Its industry’s money flow (input-output)interactive
Loading the interactive chart…
About Advance Auto Parts
Unless the context otherwise requires, the “Company,” “Advance,” and similar terms refer to Advance Auto Parts, Inc., its subsidiaries and their respective operations on a consolidated basis. The Company’s fiscal year consists of 52 or 53 weeks ending on the Saturday closest to December 31 st each year. The Company’s previous three fiscal years ended on December 28, 2024 (“2024”), December 30, 2023 (“2023”) and December 31, 2022 (“2022”) and each included fifty-two weeks of operations. Advance Auto Parts, Inc. and its subsidiaries is a leading automotive aftermarket parts provider in North America, serving both professional installers (“professional”) and “do-it-yourself” (“DIY”) customers, as well as independently-owned operators.
In its own words, from its 10-K, filed Feb 26, 2025.
Advance Auto Parts against its Retail-Auto & Home Supply Stores peers
The largest companies of the same SEC industry, each at its latest quarter. Revenue growth: -1% against the peers' median -1%. Operating margin: 2.3% against the peers' median 6.1%.
| Company | Quarter | Revenue | Y/Y | Op. margin |
|---|---|---|---|---|
| AAP Advance Auto Parts | Q3 2026 | $2.0B | -1% | 2.3% |
| AZO AutoZone | Q4 FY26 | $6.6B | +6% | 20.0% |
| ORLY O'Reilly Automotive | Q3 2026 | $5.1B | +9% | 21.4% |
| HZO Marinemax | Q3 FY26 | $611M | -7% | 6.1% |
| ONEW OneWater Marine | Q3 FY26 | $531M | -4% | 6.7% |
| PRTS CarParts.com | Q3 2026 | $129M | +1% | -2.9% |
| ALDS APPlife Digital Solutions | Q4 FY26 | $222K | -27% | n/m |
| FFLO Free Flow USA | Q2 2026 | $4K | — | -457.3% |
Source: Advance Auto Parts 10-Q on SEC EDGAR · CIK 1158449 · Retail-Auto & Home Supply Stores
Guidance and outlook
13F: who owns AAP and who is buying
More on AAP
- How Advance Auto Parts makes money: revenue by segment
- Advance Auto Parts next earnings date and what analysts expect
- Advance Auto Parts stock forecast, price target and fair value
- Who owns Advance Auto Parts stock: holders, funds and Congress trades
- Advance Auto Parts guidance and outlook
- Is Advance Auto Parts a takeover target? LBO and rumors
- Advance Auto Parts recalls, complaints and regulation
History
Every quarter: Q3 2026 results · Q2 2026 results · Q4 2025 results · Q3 2025 results · Q2 2025 results · Q4 2024 results