Filing Flows › Consumer Discretionary › AutoZone (AZO)
AutoZone (AZO) earnings and revenue breakdown
Latest: Q4 FY26 · 10-K filed Oct 26, 2026 · AutoZone (AZO) Q4 FY26 earnings results →
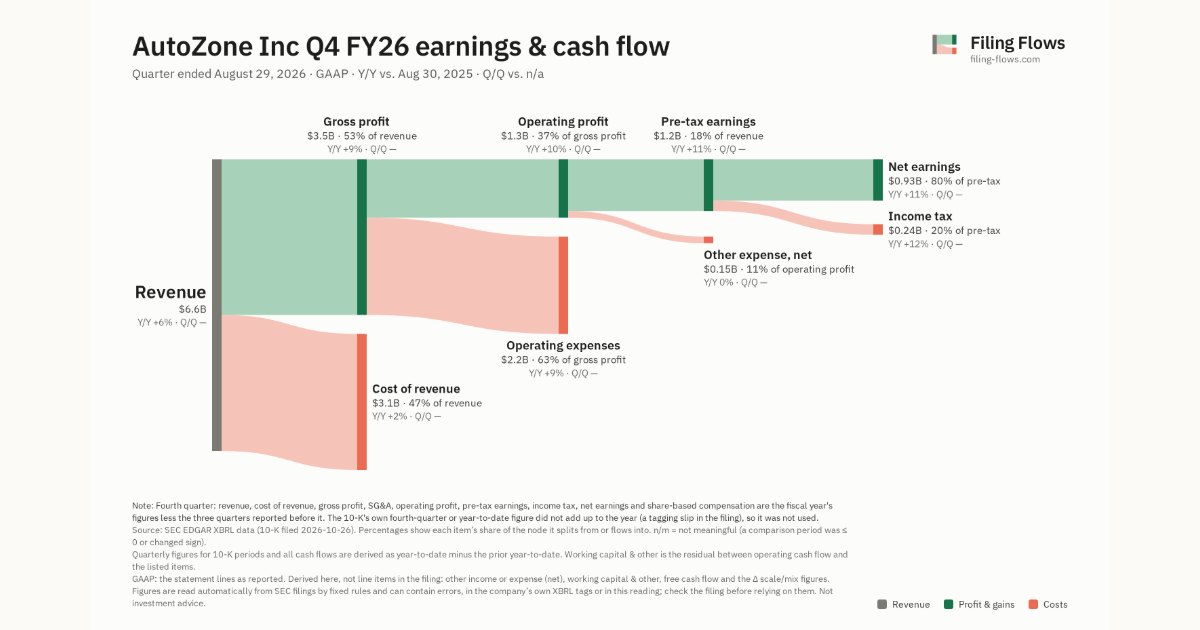
Q4 FY26 Revenue up 6% year over year to $6.6B · 14¢ of every $1 of revenue kept as net profit · operating margin 20.0%
AutoZone made $6.6B in Q4 FY26 (+6% Y/Y). Operating margin 20.0%, net earnings $932M. See where every dollar goes — costs, profit and cash — as a Sankey from the 10-K filed Oct 26, 2026.
Drawing the Sankey…
Open the interactive Sankey → click any line for what the company wrote about it, compare Y/Y and Q/Q, export as PNG or PDF
What changed this quarter
Revenue was $6.6B in Q4 FY26, up 6% year over year.
Gross margin was 53.3%, up 1.8 points from Q4 FY25. Operating profit was $1.3B, a 20.0% margin (up 0.8 points year over year). Of the extra revenue versus Q4 FY25, 34% reached operating profit, above the 19% margin then. Operating expenses grew 9% against revenue growth of 6%. Net earnings were $0.93B, up 11% year over year. The effective tax rate was 20.3%.
Quarterly history
| Quarter | Form | Filed | Revenue | Y/Y | Op. margin | Net earnings | Op. cash flow |
|---|---|---|---|---|---|---|---|
| Q4 FY26 | 10-K | Oct 26, 2026 | $6.6B | +6% | 20.0% | $932M | — |
| Q3 FY26 | 10-Q | Jun 12, 2026 | $4.8B | +8% | 19.1% | $641M | $802M |
| Q2 FY26 | 10-Q | Mar 20, 2026 | $4.3B | +8% | 16.3% | $469M | — |
| Q1 FY26 | 10-Q | Dec 19, 2025 | $4.6B | +8% | 16.9% | $531M | $944M |
| Q4 FY25 | 10-K | Oct 27, 2025 | $6.2B | — | 19.2% | $837M | — |
| Q3 FY25 | 10-Q | Jun 13, 2025 | $4.5B | +5% | 19.4% | $608M | $769M |
| Q2 FY25 | 10-Q | Mar 21, 2025 | $4.0B | +2% | 17.9% | $488M | — |
Charts
Interactive views
The same charts as the app — open one to draw it.
💵Where each $1 goesinteractive
Loading the interactive chart…
🌏Named in Asian annual reportsinteractive
Loading the interactive chart…
🔄Rotation against the market and its industry (RRG)interactive
Loading the interactive chart…
🔍Earnings qualityinteractive
Loading the interactive chart…
⚖️Fair value by methodinteractive
Loading the interactive chart…
🔭Outlook & guidanceinteractive
Loading the interactive chart…
📈Investments: gains and what it boughtinteractive
Loading the interactive chart…
🏭Its industry’s money flow (input-output)interactive
Loading the interactive chart…
About AutoZone
AutoZone, Inc. (“AutoZone,” the “Company,” “we,” “our” or “us”) is a leading retailer and distributor of automotive replacement parts and accessories in the Americas. We began operations in 1979 and at August 29, 2026, operated 6,863 stores in the United States (“U.S.”), 1,001 stores in Mexico and 167 stores in Brazil. Each store carries an extensive product line for cars, sport utility vehicles, vans and light duty trucks, including new and remanufactured automotive hard parts, maintenance items, accessories and non-automotive products. At August 29, 2026, in 6,443 of our domestic stores as well as the vast majority of our stores in Mexico and Brazil, we had a commercial sales program that provides prompt delivery of parts and other products and commercial credit to local, regional and national repair garages, dealers, service stations, fleet owners and other accounts.
In its own words, from its 10-K, filed Oct 26, 2026.
AutoZone against its Retail-Auto & Home Supply Stores peers
The largest companies of the same SEC industry, each at its latest quarter. Revenue growth: +6% against the peers' median -1%. Operating margin: 20.0% against the peers' median 6.1%.
| Company | Quarter | Revenue | Y/Y | Op. margin |
|---|---|---|---|---|
| AZO AutoZone | Q4 FY26 | $6.6B | +6% | 20.0% |
| ORLY O'Reilly Automotive | Q3 2026 | $5.1B | +9% | 21.4% |
| AAP Advance Auto Parts | Q3 2026 | $2.0B | -1% | 2.3% |
| HZO Marinemax | Q3 FY26 | $611M | -7% | 6.1% |
| ONEW OneWater Marine | Q3 FY26 | $531M | -4% | 6.7% |
| PRTS CarParts.com | Q3 2026 | $129M | +1% | -2.9% |
| ALDS APPlife Digital Solutions | Q4 FY26 | $222K | -27% | n/m |
| FFLO Free Flow USA | Q2 2026 | $4K | — | -457.3% |
Source: AutoZone 10-K on SEC EDGAR · CIK 866787 · Retail-Auto & Home Supply Stores
Guidance and outlook
13F: who owns AZO and who is buying
More on AZO
History
Every quarter: Q4 FY26 results · Q3 FY26 results · Q2 FY26 results · Q1 FY26 results · Q4 FY25 results · Q3 FY25 results · Q2 FY25 results