Filing Flows › Technology › Electronic Arts
Electronic Arts earnings and revenue breakdown
Latest: Q1 FY27 · 10-Q filed Aug 3, 2026
Q1 FY27 Revenue up 19% year over year to $2.0B · 20¢ of every $1 of revenue kept as net profit · operating margin 25.8%
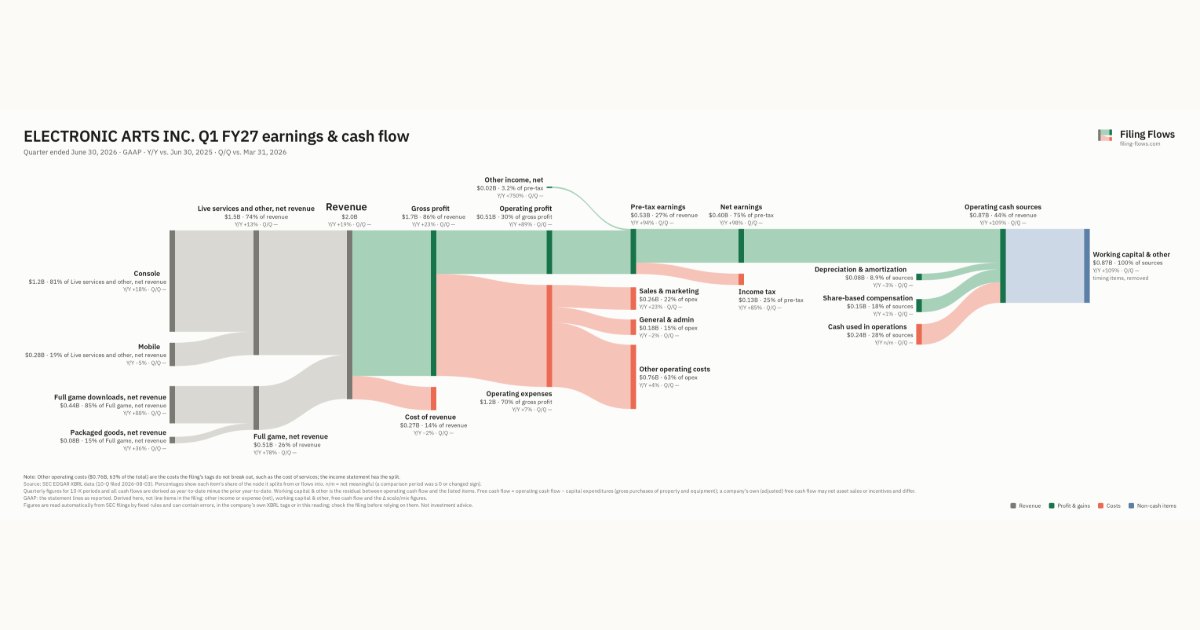
Electronic Arts made $2.0B in Q1 FY27 (+19% Y/Y): Live services and other, net revenue $1.5B, Full game, net revenue $514M. Operating margin 25.8%, net earnings $397M. See where every dollar goes — costs, profit and cash — as a Sankey from the 10-Q filed Aug 3, 2026.
Drawing the Sankey…
Open the interactive Sankey → click any line for what the company wrote about it, compare Y/Y and Q/Q, export as PNG or PDF
What changed this quarter
Revenue was $2.0B in Q1 FY27, up 19% year over year and down 6% from the previous quarter. Console was the largest line at 60% of revenue. Full game downloads, net revenue added $0.20B year over year (up 88%), 65% of the total change. Mobile declined 5%.
Gross margin was 86.2%, up 2.9 points from Q1 FY26. Operating profit was $0.51B, a 25.8% margin (up 9.6 points year over year). Of the extra revenue versus Q1 FY26, 77% reached operating profit, above the 16% margin then. Operating expenses grew 7% against revenue growth of 19%. The fastest-growing cost line was Sales & marketing (+23%). Net earnings were $0.40B, up 98% year over year. The effective tax rate was 25.1%.
Operating cash flow was −$0.24B. Non-cash charges added back $0.08B of depreciation and amortization and $0.15B of share-based compensation. Working capital and other items used $0.87B. Capital expenditures of $0.08B exceeded it, leaving free cash flow of −$0.32B.
Quarterly history
| Quarter | Form | Filed | Revenue | Y/Y | Op. margin | Net earnings | Op. cash flow |
|---|---|---|---|---|---|---|---|
| Q1 FY27 | 10-Q | Aug 3, 2026 | $2.0B | +19% | 25.8% | $397M | −$242M |
| Q3 FY26 | 10-Q | Feb 3, 2026 | $1.9B | +1% | 6.7% | $88.0M | $1.8B |
| Q2 FY26 | 10-Q | Oct 31, 2025 | $1.8B | -9% | 10.9% | $137M | $130M |
| Q1 FY26 | 10-Q | Aug 1, 2025 | $1.7B | +0.7% | 16.2% | $201M | $17.0M |
| Q4 FY25 | 10-K | May 13, 2025 | $1.9B | +6% | 20.8% | $254M | $549M |
| Q3 FY25 | 10-Q | Feb 5, 2025 | $1.9B | -3% | 20.0% | $293M | $1.2B |
Charts
Interactive views
The same charts as the app — open one to draw it.
💵Where each $1 goesinteractive
Loading the interactive chart…
🌏Named in Asian annual reportsinteractive
Loading the interactive chart…
🏭Its industry’s money flow (input-output)interactive
Loading the interactive chart…
Customers and suppliers named in filings
Sells to
- SONY — 39% of its revenue · Stated in 10-K (sentence) · source
- MSFT — 17% of its revenue · Stated in 10-K (sentence) · source
About Electronic Arts
Electronic Arts is a global leader in digital interactive entertainment. We develop, market, publish and deliver games, content and services that can be experienced on game consoles, PCs and mobile devices. We create innovative games and experiences that deliver high-quality interactive entertainment and drive engagement across our global network of hundreds of millions of players. We are focusing on building games and experiences that grow the global online communities around our key franchises; deepening engagement through connecting interactive storytelling to key intellectual property; and harnessing our communities to grow in, around, and beyond our games. We develop and publish games and experiences across diverse genres, such as sports, racing, first-person shooter, action, role-playing and simulation.
In its own words, from its 10-K, filed May 11, 2026.
Electronic Arts against its Services-Prepackaged Software peers
The largest companies of the same SEC industry, each at its latest quarter. Revenue growth: +19% against the peers' median +19%. Operating margin: 25.8% against the peers' median 20.5%.
| Company | Quarter | Revenue | Y/Y | Op. margin |
|---|---|---|---|---|
| Electronic Arts | Q1 FY27 | $2.0B | +19% | 25.8% |
| MSFT Microsoft | Q1 FY27 | $92.3B | +19% | 49.8% |
| ORCL Oracle | Q1 FY27 | $19.3B | +30% | 34.8% |
| CRM Salesforce | Q2 FY27 | $11.3B | +11% | 20.5% |
| ADBE Adobe | Q3 FY26 | $6.8B | +13% | 34.8% |
| XYZ Block | Q3 2026 | $6.7B | +10% | 6.4% |
| INTU Intuit | Q4 FY26 | $4.4B | +14% | 10.9% |
| NOW ServiceNow | Q3 2026 | $4.1B | +20% | 9.4% |
| SHOP Shopify | Q3 2026 | $3.7B | +32% | 15.2% |
Source: Electronic Arts 10-Q on SEC EDGAR · CIK 712515 · Services-Prepackaged Software