Filing Flows › Materials › Commercial Metals (CMC)
Commercial Metals (CMC) earnings and revenue breakdown
Latest: Q4 FY26 · 10-K filed Oct 16, 2026 · Commercial Metals (CMC) Q4 FY26 earnings results →
Q4 FY26 Revenue up 26% year over year to $2.7B · 8¢ of every $1 of revenue kept as net profit · operating margin 8.6%
Commercial Metals made $2.7B in Q4 FY26 (+26% Y/Y). Operating margin 8.6%, net earnings $213M. See where every dollar goes — costs, profit and cash — as a Sankey from the 10-K filed Oct 16, 2026.
Drawing the Sankey…
Open the interactive Sankey → click any line for what the company wrote about it, compare Y/Y and Q/Q, export as PNG or PDF
What changed this quarter
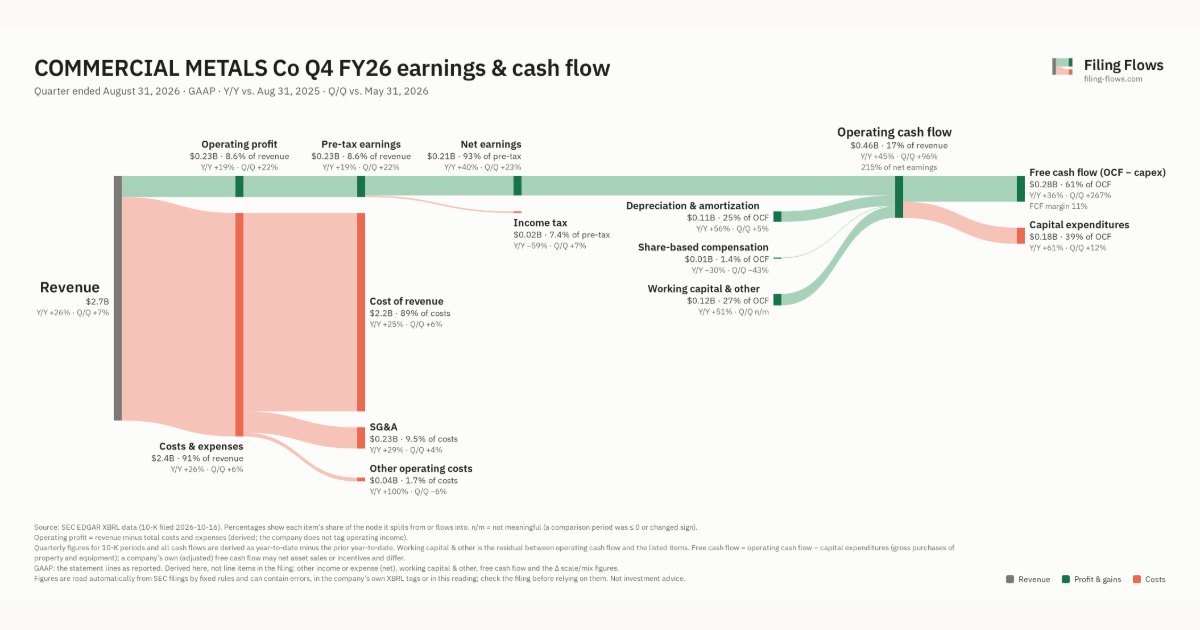
Revenue was $2.7B in Q4 FY26, up 26% year over year and up 7% from the previous quarter.
Operating profit was $0.23B, a 8.6% margin (down 0.5 points year over year). Of the extra revenue versus Q4 FY25, 7% reached operating profit, below the 9% margin then. Total costs grew 26% against revenue growth of 26%. The fastest-growing cost line was Other operating costs (+100%). Net earnings were $0.21B, up 40% year over year. The effective tax rate was 7.4%.
Operating cash flow was $0.46B (up 45% year over year), 215% of net earnings. Non-cash charges added back $0.11B of depreciation and amortization and $0.01B of share-based compensation. Working capital and other items added $0.12B. Capital expenditures of $0.18B left free cash flow of $0.28B.
Quarterly history
| Quarter | Form | Filed | Revenue | Y/Y | Op. margin | Net earnings | Op. cash flow |
|---|---|---|---|---|---|---|---|
| Q4 FY26 | 10-K | Oct 16, 2026 | $2.7B | +26% | 8.6% | $213M | $456M |
| Q3 FY26 | 10-Q | Jun 29, 2026 | $2.5B | +23% | 7.6% | $173M | $233M |
| Q2 FY26 | 10-Q | Mar 31, 2026 | $2.1B | +22% | 5.1% | $93.0M | $166M |
| Q1 FY26 | 10-Q | Jan 8, 2026 | $2.1B | +11% | 8.6% | $177M | $204M |
| Q4 FY25 | 10-K | Oct 16, 2025 | $2.1B | +6% | 9.1% | $152M | $315M |
| Q3 FY25 | 10-Q | Jun 24, 2025 | $2.0B | -3% | 5.4% | $83.1M | $154M |
| Q2 FY25 | 10-Q | Mar 25, 2025 | $1.8B | -5% | 2.1% | $25.5M | $32.4M |
Charts
Interactive views
The same charts as the app — open one to draw it.
💵Where each $1 goesinteractive
Loading the interactive chart…
🌏Named in Asian annual reportsinteractive
Loading the interactive chart…
🔄Rotation against the market and its industry (RRG)interactive
Loading the interactive chart…
🔍Earnings qualityinteractive
Loading the interactive chart…
⚖️Fair value by methodinteractive
Loading the interactive chart…
🔭Outlook & guidanceinteractive
Loading the interactive chart…
📈Investments: gains and what it boughtinteractive
Loading the interactive chart…
🏭Its industry’s money flow (input-output)interactive
Loading the interactive chart…
About Commercial Metals
This annual report on Form 10-K (hereinafter referred to as the "Annual Report") contains forward-looking statements within the meaning of Section 27A of the Securities Act of 1933, as amended (the "Securities Act"), Section 21E of the Securities Exchange Act of 1934, as amended (the "Exchange Act") and the Private Securities Litigation Reform Act of 1995. Actual results, performance or achievements could differ materially from those projected in the forward-looking statements as a result of a number of risks, uncertainties and other factors.
In its own words, from its 10-K, filed Oct 16, 2026.
Commercial Metals against its Steel Works, Blast Furnaces & Rolling Mills (Coke Ovens) peers
The largest companies of the same SEC industry, each at its latest quarter. Revenue growth: +26% against the peers' median +10%. Operating margin: 8.6% against the peers' median 9.6%.
| Company | Quarter | Revenue | Y/Y | Op. margin |
|---|---|---|---|---|
| CMC Commercial Metals | Q4 FY26 | $2.7B | +26% | 8.6% |
| NUE Nucor | Q3 2026 | $11.2B | +32% | 15.2% |
| STLD Steel Dynamics | Q3 2026 | $6.5B | +35% | 15.5% |
| CRS Carpenter Technology | Q1 FY27 | $798M | +9% | 24.6% |
| SXC SunCoke Energy | Q3 2026 | $486M | -0.2% | 8.4% |
| MTUS Metallus | Q3 2026 | $337M | +10% | 9.6% |
| TWI Titan International | Q3 2026 | $335M | -6% | -0.3% |
Source: Commercial Metals 10-K on SEC EDGAR · CIK 22444 · Steel Works, Blast Furnaces & Rolling Mills (Coke Ovens)
13F: who owns CMC and who is buying
More on CMC
History
Every quarter: Q4 FY26 results · Q3 FY26 results · Q2 FY26 results · Q1 FY26 results · Q4 FY25 results · Q3 FY25 results · Q2 FY25 results