Filing Flows › Materials › Steel Dynamics (STLD)
Steel Dynamics (STLD) earnings and revenue breakdown
Latest: Q3 2026 · 10-Q filed Oct 23, 2026 · Steel Dynamics (STLD) Q3 2026 earnings results →
Q3 2026 Revenue up 35% year over year to $6.5B · 12¢ of every $1 of revenue kept as net profit · operating margin 15.5%
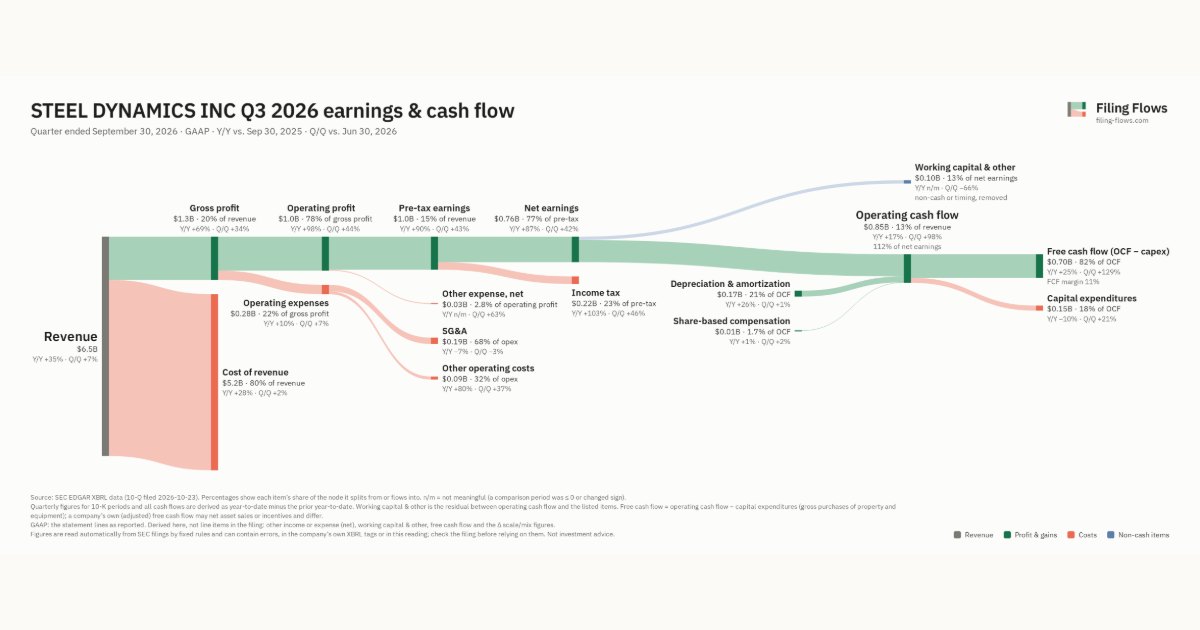
Steel Dynamics made $6.5B in Q3 2026 (+35% Y/Y). Operating margin 15.5%, net earnings $756M. See where every dollar goes — costs, profit and cash — as a Sankey from the 10-Q filed Oct 23, 2026.
Drawing the Sankey…
Open the interactive Sankey → click any line for what the company wrote about it, compare Y/Y and Q/Q, export as PNG or PDF
What changed this quarter
Revenue was $6.5B in Q3 2026, up 35% year over year and up 7% from the previous quarter.
Gross margin was 19.7%, up 4.0 points from Q3 2025. Operating profit was $1.0B, a 15.5% margin (up 4.9 points year over year). Of the extra revenue versus Q3 2025, 30% reached operating profit, above the 11% margin then. Operating expenses grew 10% against revenue growth of 35%. The fastest-growing cost line was Other operating costs (+80%). Net earnings were $0.76B, up 87% year over year. The effective tax rate was 22.8%.
Operating cash flow was $0.85B (up 17% year over year), 112% of net earnings. Non-cash charges added back $0.17B of depreciation and amortization and $0.01B of share-based compensation. Working capital and other items used $0.10B. Capital expenditures of $0.15B left free cash flow of $0.70B.
Quarterly history
| Quarter | Form | Filed | Revenue | Y/Y | Op. margin | Net earnings | Op. cash flow |
|---|---|---|---|---|---|---|---|
| Q3 2026 | 10-Q | Oct 23, 2026 | $6.5B | +35% | 15.5% | $756M | $846M |
| Q2 2026 | 10-Q | Jul 28, 2026 | $6.1B | +33% | 11.5% | $531M | $428M |
| Q1 2026 | 10-Q | Apr 27, 2026 | $5.2B | +19% | 10.3% | $400M | $148M |
| Q4 2025 | 10-K | Feb 27, 2026 | $4.4B | +14% | 7.0% | $265M | $273M |
| Q3 2025 | 10-Q | Oct 24, 2025 | $4.8B | +11% | 10.5% | $404M | $723M |
| Q2 2025 | 10-Q | Aug 11, 2025 | $4.6B | -2% | 8.4% | $301M | $302M |
| Q1 2025 | 10-Q | May 12, 2025 | $4.4B | -7% | 6.3% | $218M | $153M |
Charts
Interactive views
The same charts as the app — open one to draw it.
💵Where each $1 goesinteractive
Loading the interactive chart…
🌏Named in Asian annual reportsinteractive
Loading the interactive chart…
🔄Rotation against the market and its industry (RRG)interactive
Loading the interactive chart…
🔍Earnings qualityinteractive
Loading the interactive chart…
⚖️Fair value by methodinteractive
Loading the interactive chart…
🔭Outlook & guidanceinteractive
Loading the interactive chart…
📈Investments: gains and what it boughtinteractive
Loading the interactive chart…
🏭Its industry’s money flow (input-output)interactive
Loading the interactive chart…
Customers and suppliers named in filings
Sells to
About Steel Dynamics
Steel Dynamics, Inc. is a leading industrial metals solutions company, with facilities located throughout the United States and Mexico. The company operates a circular manufacturing model, producing high-quality, lower-carbon-emission products with recycled scrap as the primary input. Steel Dynamics is one of the largest domestic steel producers and metals recyclers in North America based on estimated steelmaking and steel coating capacity of approximately 16 million tons and actual metals recycling volumes as of December 31, 2025, with one of the most diversified product and end market portfolios in the domestic steel industry, combined with a meaningful downstream steel fabrication platform.
In its own words, from its 10-K, filed Feb 27, 2026.
Steel Dynamics against its Steel Works, Blast Furnaces & Rolling Mills (Coke Ovens) peers
The largest companies of the same SEC industry, each at its latest quarter. Revenue growth: +35% against the peers' median +10%. Operating margin: 15.5% against the peers' median 9.6%.
| Company | Quarter | Revenue | Y/Y | Op. margin |
|---|---|---|---|---|
| STLD Steel Dynamics | Q3 2026 | $6.5B | +35% | 15.5% |
| NUE Nucor | Q3 2026 | $11.2B | +32% | 15.2% |
| CMC Commercial Metals | Q4 FY26 | $2.7B | +26% | 8.6% |
| CRS Carpenter Technology | Q1 FY27 | $798M | +9% | 24.6% |
| SXC SunCoke Energy | Q3 2026 | $486M | -0.2% | 8.4% |
| MTUS Metallus | Q3 2026 | $337M | +10% | 9.6% |
| TWI Titan International | Q3 2026 | $335M | -6% | -0.3% |
Source: Steel Dynamics 10-Q on SEC EDGAR · CIK 1022671 · Steel Works, Blast Furnaces & Rolling Mills (Coke Ovens)
Guidance and outlook
13F: who owns STLD and who is buying
More on STLD
- How Steel Dynamics makes money: revenue by segment
- Steel Dynamics stock forecast, price target and fair value
- Who owns Steel Dynamics stock: holders, funds and Congress trades
- Steel Dynamics guidance and outlook
- Is Steel Dynamics a takeover target? LBO and rumors
- Steel Dynamics recalls, complaints and regulation
History
Every quarter: Q3 2026 results · Q2 2026 results · Q1 2026 results · Q4 2025 results · Q3 2025 results · Q2 2025 results · Q1 2025 results