Filing Flows › Materials › Nucor (NUE)
Nucor (NUE) earnings and revenue breakdown
Latest: Q3 2026 · 8-K filed Oct 26, 2026
Q3 2026 Revenue up 32% year over year to $11.2B · 12¢ of every $1 of revenue kept as net profit · operating margin 15.2%
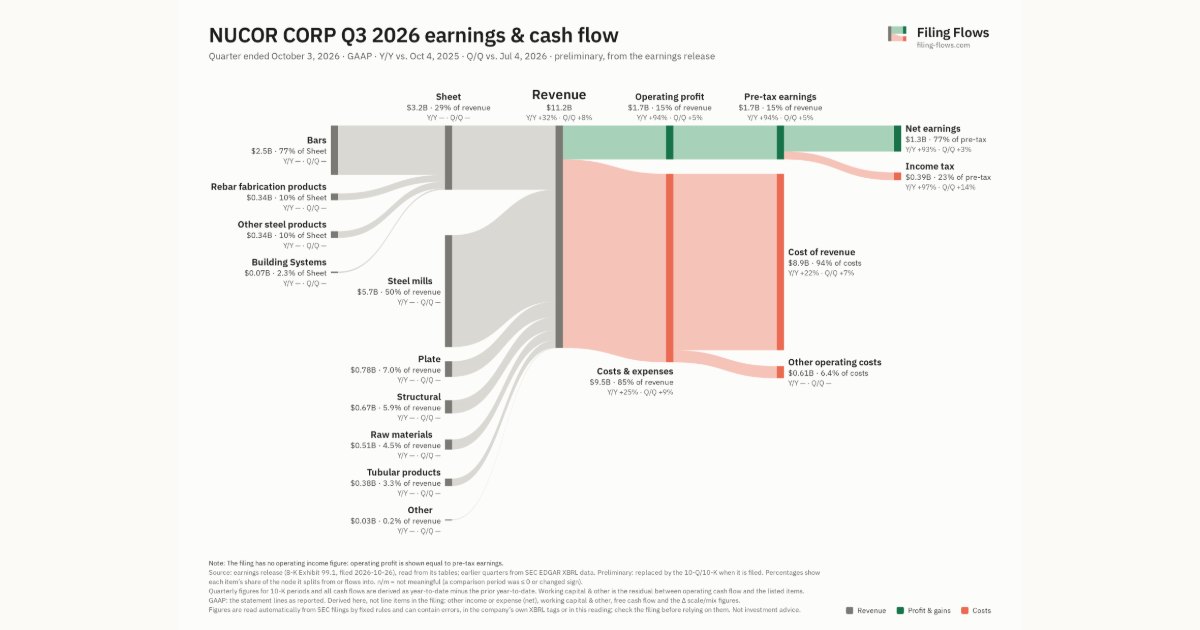
Nucor made $11.2B in Q3 2026 (+32% Y/Y). Operating margin 15.2%, net earnings $1.3B. See where every dollar goes — costs, profit and cash — as a Sankey from the 8-K filed Oct 26, 2026 (preliminary, from the earnings release).
Drawing the Sankey…
Open the interactive Sankey → click any line for what the company wrote about it, compare Y/Y and Q/Q, export as PNG or PDF
What changed this quarter
Revenue was $11.2B in Q3 2026, up 32% year over year and up 8% from the previous quarter.
Operating profit was $1.7B, a 15.2% margin (up 4.9 points year over year). Of the extra revenue versus Q3 2025, 30% reached operating profit, above the 10% margin then. Total costs grew 25% against revenue growth of 32%. The fastest-growing cost line was Cost of revenue (+22%). Net earnings were $1.3B, up 117% year over year. The effective tax rate was 23.0%.
Quarterly history
| Quarter | Form | Filed | Revenue | Y/Y | Op. margin | Net earnings | Op. cash flow |
|---|---|---|---|---|---|---|---|
| Q3 2026 | 8-K | Oct 26, 2026 | $11.2B | +32% | 15.2% | $1.3B | — |
| Q2 2026 | 10-Q | Aug 12, 2026 | $10.4B | +23% | 15.6% | $1.2B | $1.4B |
| Q1 2026 | 10-Q | May 13, 2026 | $9.5B | +21% | 11.5% | $743M | $886M |
| Q4 2025 | 10-K | Feb 25, 2026 | $7.7B | +9% | 6.5% | $378M | $799M |
| Q3 2025 | 10-Q | Nov 12, 2025 | $8.5B | +14% | 10.4% | $607M | $1.3B |
| Q2 2025 | 10-Q | Aug 13, 2025 | $8.5B | +5% | 10.6% | $603M | $732M |
| Q1 2025 | 10-Q | May 14, 2025 | $7.8B | -4% | 3.6% | $156M | $364M |
Charts
Interactive views
The same charts as the app — open one to draw it.
💵Where each $1 goesinteractive
Loading the interactive chart…
🌏Named in Asian annual reportsinteractive
Loading the interactive chart…
🔄Rotation against the market and its industry (RRG)interactive
Loading the interactive chart…
🔍Earnings qualityinteractive
Loading the interactive chart…
⚖️Fair value by methodinteractive
Loading the interactive chart…
🔭Outlook & guidanceinteractive
Loading the interactive chart…
📈Investments: gains and what it boughtinteractive
Loading the interactive chart…
🏭Its industry’s money flow (input-output)interactive
Loading the interactive chart…
About Nucor
Nucor and its affiliates are manufacturers of steel and steel products, with operating facilities in the United States, Canada and Mexico. Products produced include: carbon and alloy steel — in bars, beams, sheet and plate; hollow structural section tubing; electrical conduit; steel racking; steel piling; steel joists and joist girders; steel deck; fabricated concrete reinforcing steel; cold finished steel; precision castings; steel fasteners; metal building systems; insulated metal panels; overhead doors; steel grating; wire and wire mesh; and utility structures. Nucor, through The David J. Joseph Company and its affiliates, also brokers ferrous and nonferrous metals, pig iron and hot briquetted iron / direct reduced iron; supplies ferro-alloys; and processes ferrous and nonferrous scrap. Nucor is North America’s largest recycler.
In its own words, from its 8-K, filed Jul 27, 2026.
Nucor against its Steel Works, Blast Furnaces & Rolling Mills (Coke Ovens) peers
The largest companies of the same SEC industry, each at its latest quarter. Revenue growth: +32% against the peers' median +10%. Operating margin: 15.2% against the peers' median 9.6%.
| Company | Quarter | Revenue | Y/Y | Op. margin |
|---|---|---|---|---|
| NUE Nucor | Q3 2026 | $11.2B | +32% | 15.2% |
| STLD Steel Dynamics | Q3 2026 | $6.5B | +35% | 15.5% |
| CMC Commercial Metals | Q4 FY26 | $2.7B | +26% | 8.6% |
| CRS Carpenter Technology | Q1 FY27 | $798M | +9% | 24.6% |
| SXC SunCoke Energy | Q3 2026 | $486M | -0.2% | 8.4% |
| MTUS Metallus | Q3 2026 | $337M | +10% | 9.6% |
| TWI Titan International | Q3 2026 | $335M | -6% | -0.3% |
Source: Nucor 8-K on SEC EDGAR · CIK 73309 · Steel Works, Blast Furnaces & Rolling Mills (Coke Ovens)
Guidance and outlook
13F: who owns NUE and who is buying
More on NUE
History
Every quarter: Q3 2026 results · Q2 2026 results · Q1 2026 results · Q4 2025 results · Q3 2025 results · Q2 2025 results · Q1 2025 results