Filing Flows › Technology › Gen Digital (GEN)
Gen Digital (GEN) earnings and revenue breakdown
Latest: Q2 FY27 · 10-Q filed Oct 29, 2026 · Gen Digital (GEN) Q2 FY27 earnings results →
Q2 FY27 Revenue up 12% year over year to $1.4B · 21¢ of every $1 of revenue kept as net profit · operating margin 37.0%
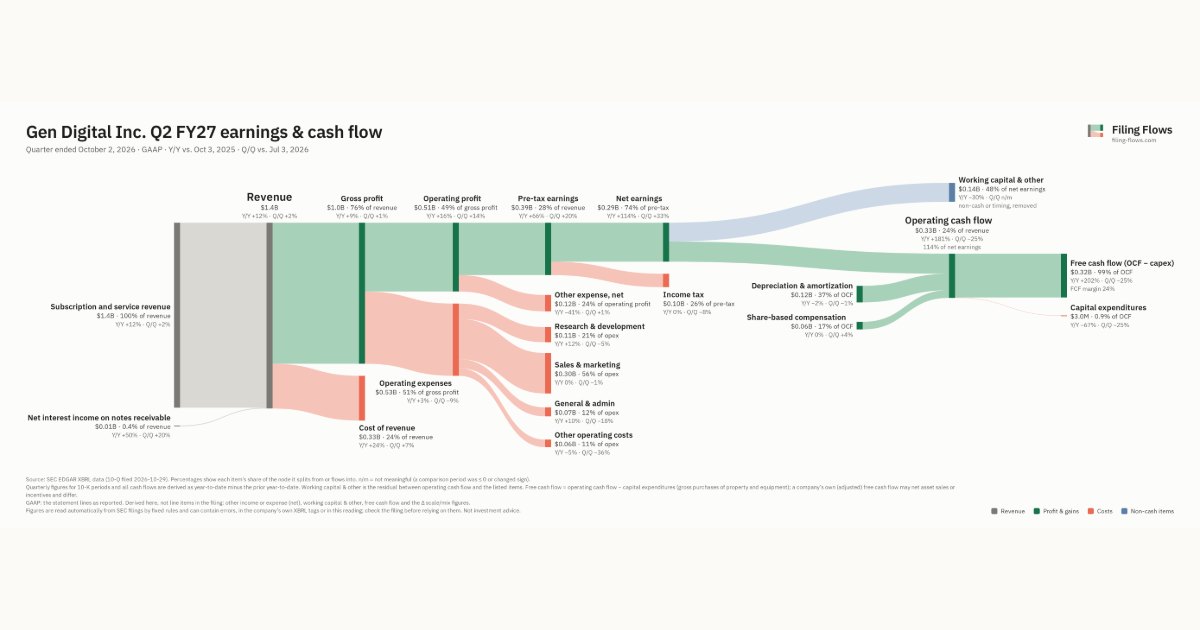
Gen Digital made $1.4B in Q2 FY27 (+12% Y/Y): Subscription and service revenue $1.4B, Net interest income on notes receivable $6.0M. Operating margin 37.0%, net earnings $287M. See where every dollar goes — costs, profit and cash — as a Sankey from the 10-Q filed Oct 29, 2026.
Drawing the Sankey…
Open the interactive Sankey → click any line for what the company wrote about it, compare Y/Y and Q/Q, export as PNG or PDF
What changed this quarter
Revenue was $1.4B in Q2 FY27, up 12% year over year and up 2% from the previous quarter. Subscription and service revenue was the largest line at 100% of revenue. Subscription and service revenue added $0.15B year over year (up 12%), 99% of the total change.
Gross margin was 75.9%, down 2.3 points from Q2 FY26. Operating profit was $0.51B, a 37.0% margin (up 1.1 points year over year). Of the extra revenue versus Q2 FY26, 46% reached operating profit, above the 36% margin then. Operating expenses grew 3% against revenue growth of 12%. The fastest-growing cost line was Research & development (+12%). Net earnings were $0.29B, up 114% year over year. The effective tax rate was 25.6%.
Operating cash flow was $0.33B (up 181% year over year), 114% of net earnings. Non-cash charges added back $0.12B of depreciation and amortization and $0.06B of share-based compensation. Working capital and other items used $0.14B. Capital expenditures of $3.0M left free cash flow of $0.32B.
Quarterly history
| Quarter | Form | Filed | Revenue | Y/Y | Op. margin | Net earnings | Op. cash flow |
|---|---|---|---|---|---|---|---|
| Q2 FY27 | 10-Q | Oct 29, 2026 | $1.4B | +12% | 37.0% | $287M | $326M |
| Q1 FY27 | 10-Q | Aug 7, 2026 | $1.3B | +6% | 33.2% | $215M | $434M |
| Q4 FY26 | 10-K | May 21, 2026 | $1.3B | +27% | 62.6% | $512M | $479M |
| Q3 FY26 | 10-Q | Feb 6, 2026 | $1.2B | +26% | 34.9% | $192M | $541M |
| Q2 FY26 | 10-Q | Nov 7, 2025 | $1.2B | +25% | 35.9% | $134M | $116M |
| Q1 FY26 | 10-Q | Aug 13, 2025 | $1.3B | +30% | 35.5% | $135M | $409M |
| Q4 FY25 | 10-K | May 15, 2025 | $1.0B | +5% | 41.3% | $142M | $473M |
Charts
Interactive views
The same charts as the app — open one to draw it.
💵Where each $1 goesinteractive
Loading the interactive chart…
🌏Named in Asian annual reportsinteractive
Loading the interactive chart…
🔄Rotation against the market and its industry (RRG)interactive
Loading the interactive chart…
🔍Earnings qualityinteractive
Loading the interactive chart…
⚖️Fair value by methodinteractive
Loading the interactive chart…
🔭Outlook & guidanceinteractive
Loading the interactive chart…
📈Investments: gains and what it boughtinteractive
Loading the interactive chart…
🏭Its industry’s money flow (input-output)interactive
Loading the interactive chart…
About Gen Digital
Mission: We create innovative and easy-to-use technology solutions that help people grow, manage and secure their digital and financial lives. Protecting people is what inspires us, and our people are at the core of what we do. We seek to attract talent that embraces the following values:
In its own words, from its 10-K, filed May 21, 2026.
Gen Digital against its Services-Prepackaged Software peers
The largest companies of the same SEC industry, each at its latest quarter. Revenue growth: +12% against the peers' median +14%. Operating margin: 37.0% against the peers' median 20.5%.
| Company | Quarter | Revenue | Y/Y | Op. margin |
|---|---|---|---|---|
| GEN Gen Digital | Q2 FY27 | $1.4B | +12% | 37.0% |
| MSFT Microsoft | Q1 FY27 | $92.3B | +19% | 49.8% |
| ORCL Oracle | Q1 FY27 | $19.3B | +30% | 34.8% |
| CRM Salesforce | Q2 FY27 | $11.3B | +11% | 20.5% |
| ADBE Adobe | Q3 FY26 | $6.8B | +13% | 34.8% |
| XYZ Block | Q3 2026 | $6.7B | +10% | 6.4% |
| INTU Intuit | Q4 FY26 | $4.4B | +14% | 10.9% |
| NOW ServiceNow | Q3 2026 | $4.1B | +20% | 9.4% |
| SHOP Shopify | Q3 2026 | $3.7B | +32% | 15.2% |
Source: Gen Digital 10-Q on SEC EDGAR · CIK 849399 · Services-Prepackaged Software
Guidance and outlook
13F: who owns GEN and who is buying
More on GEN
History
Every quarter: Q2 FY27 results · Q1 FY27 results · Q4 FY26 results · Q3 FY26 results · Q2 FY26 results · Q1 FY26 results · Q4 FY25 results
- Gen Digital guidance history: guided vs reported
- Gen Digital gross margin by quarter
- Gen Digital operating margin by quarter
- Gen Digital net income by quarter
- Gen Digital free cash flow by quarter
- Gen Digital R&D spending by quarter
- Gen Digital capital expenditures by quarter
- Gen Digital Subscription and service revenue revenue by quarter
- Gen Digital Net interest income on notes receivable revenue by quarter