Filing Flows › Industrials › KBR (KBR)
KBR (KBR) earnings and revenue breakdown
Latest: Q3 2026 · 10-Q filed Oct 29, 2026 · KBR (KBR) Q3 2026 earnings results →
Q3 2026 Revenue up 5% year over year to $2.0B · 7¢ of every $1 of revenue kept as net profit · operating margin 9.2%
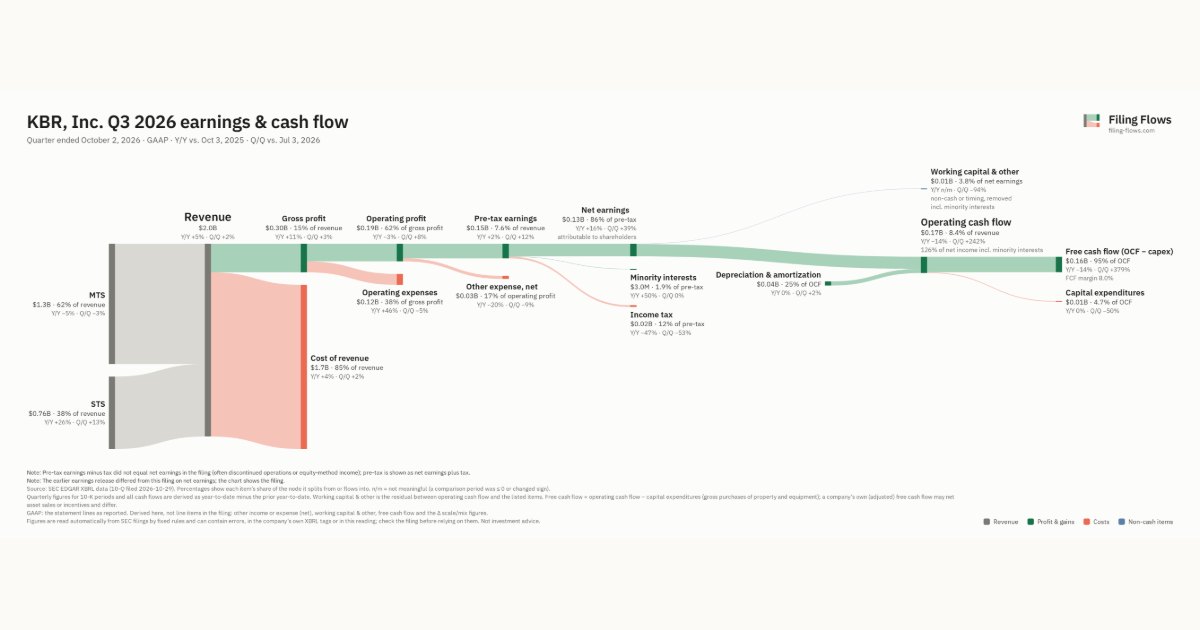
KBR made $2.0B in Q3 2026 (+5% Y/Y): MTS $1.3B, STS $762M. Operating margin 9.2%, net earnings $133M. See where every dollar goes — costs, profit and cash — as a Sankey from the 10-Q filed Oct 29, 2026.
Drawing the Sankey…
Open the interactive Sankey → click any line for what the company wrote about it, compare Y/Y and Q/Q, export as PNG or PDF
What changed this quarter
Revenue was $2.0B in Q3 2026, up 5% year over year and up 2% from the previous quarter. MTS was the largest line at 62% of revenue. STS added $0.16B year over year (up 26%), 162% of the total change. MTS declined 5%.
Gross margin was 14.8%, up 0.9 points from Q3 2025. Operating profit was $0.19B, a 9.2% margin (down 0.7 points year over year). Operating profit fell $0.01B even though revenue rose $0.10B versus Q3 2025, so costs grew faster than sales. Operating expenses grew 46% against revenue growth of 5%. Net earnings were $0.13B, up 16% year over year. The effective tax rate was 11.7%.
Operating cash flow was $0.17B (down 14% year over year), 126% of net income including minority interests. Non-cash charges added back $0.04B of depreciation and amortization. Capital expenditures of $0.01B left free cash flow of $0.16B.
Quarterly history
| Quarter | Form | Filed | Revenue | Y/Y | Op. margin | Net earnings | Op. cash flow |
|---|---|---|---|---|---|---|---|
| Q3 2026 | 10-Q | Oct 29, 2026 | $2.0B | +5% | 9.2% | $133M | $171M |
| Q2 2026 | 10-Q | Jul 30, 2026 | $2.0B | +2% | 8.7% | $96.0M | $50.0M |
| Q1 2026 | 10-Q | May 5, 2026 | $1.9B | -5% | 9.4% | $102M | $110M |
| Q4 2025 | 10-K | Feb 26, 2026 | $1.9B | -11% | 10.1% | $111M | $51.0M |
| Q3 2025 | 10-Q | Oct 30, 2025 | $1.9B | -0.3% | 9.9% | $115M | $198M |
| Q2 2025 | 10-Q | Jul 31, 2025 | $2.0B | +6% | 9.9% | $73.0M | $217M |
| Q1 2025 | 10-Q | May 6, 2025 | $2.0B | +11% | 10.0% | $115M | $98.0M |
Charts
Interactive views
The same charts as the app — open one to draw it.
💵Where each $1 goesinteractive
Loading the interactive chart…
🌏Named in Asian annual reportsinteractive
Loading the interactive chart…
🔄Rotation against the market and its industry (RRG)interactive
Loading the interactive chart…
🔍Earnings qualityinteractive
Loading the interactive chart…
⚖️Fair value by methodinteractive
Loading the interactive chart…
🔭Outlook & guidanceinteractive
Loading the interactive chart…
📈Investments: gains and what it boughtinteractive
Loading the interactive chart…
🏭Its industry’s money flow (input-output)interactive
Loading the interactive chart…
Customers and suppliers named in filings
Sells to
- U.S. government — 57% of its revenue · Stated in 10-K (sentence) · source
About KBR
KBR, Inc., a Delaware corporation ("KBR" or, the "Company"), delivers science, technology, engineering and logistics support solutions to the U.S. federal government, allied nations and commercial clients around the world . Drawing from its culture of innovation and mission focus, KBR creates sustainable value by combining deep domain expertise with its full-life cycle capabilities to help clients meet their most pressing challenges. Our capabilities and offerings include the following: • Leading national security and defense systems engineering; rapid prototyping; test and evaluation; aerospace acquisition support; data analytics and systems and platform integration; and sustainment engineering;
In its own words, from its 10-K, filed Feb 26, 2026.
KBR against its Heavy Construction Other Than Bldg Const - Contractors peers
The largest companies of the same SEC industry, each at its latest quarter. Revenue growth: +5% against the peers' median +28%. Operating margin: 9.2% against the peers' median 7.3%.
| Company | Quarter | Revenue | Y/Y | Op. margin |
|---|---|---|---|---|
| KBR KBR | Q3 2026 | $2.0B | +5% | 9.2% |
| J Jacobs Solutions | Q3 FY26 | $4.1B | +34% | 7.0% |
| FLR Fluor | Q3 2026 | $3.7B | +10% | 6.0% |
| GVA Granite Construction | Q3 2026 | $1.8B | +23% | 12.7% |
| STRL Sterling Infrastructure | Q3 2026 | $1.6B | +127% | 19.6% |
| ROAD Construction Partners | Q3 FY26 | $999M | +28% | 10.9% |
| MWH Solv Energy | Q2 2026 | $951M | +78% | 7.3% |
| BYOP KiNRG | Q2 2026 | $369M | — | 4.6% |
| ORN Orion Group Holdings | Q3 2026 | $256M | +14% | 3.3% |
Source: KBR 10-Q on SEC EDGAR · CIK 1357615 · Heavy Construction Other Than Bldg Const - Contractors
Guidance and outlook
13F: who owns KBR and who is buying
More on KBR
History
Every quarter: Q3 2026 results · Q2 2026 results · Q1 2026 results · Q4 2025 results · Q3 2025 results · Q2 2025 results · Q1 2025 results