Filing Flows › Industrials › Granite Construction (GVA)
Granite Construction (GVA) earnings and revenue breakdown
Latest: Q3 2026 · 10-Q filed Oct 29, 2026 · Granite Construction (GVA) Q3 2026 earnings results →
Q3 2026 Revenue up 23% year over year to $1.8B · 0¢ of every $1 of revenue kept as net profit · operating margin 12.7%
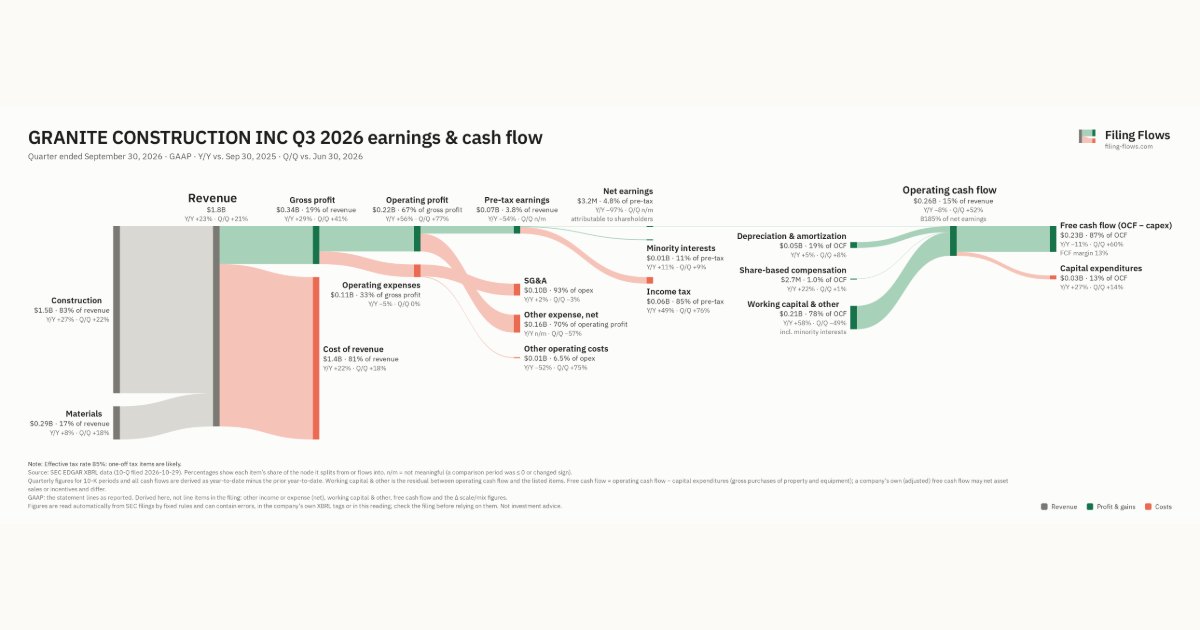
Granite Construction made $1.8B in Q3 2026 (+23% Y/Y): Construction $1.5B, Materials $292M. Operating margin 12.7%, net earnings $3.2M. See where every dollar goes — costs, profit and cash — as a Sankey from the 10-Q filed Oct 29, 2026.
Drawing the Sankey…
Open the interactive Sankey → click any line for what the company wrote about it, compare Y/Y and Q/Q, export as PNG or PDF
What changed this quarter
Revenue was $1.8B in Q3 2026, up 23% year over year and up 21% from the previous quarter. Construction was the largest line at 83% of revenue. Construction added $0.31B year over year (up 27%), 94% of the total change.
Gross margin was 19.0%, up 0.8 points from Q3 2025. Operating profit was $0.22B, a 12.7% margin (up 2.7 points year over year). Of the extra revenue versus Q3 2025, 24% reached operating profit, above the 10% margin then. Operating expenses fell 5% while revenue rose 23%. Net earnings were $3.2M, down 97% year over year. The effective tax rate was 84.5%.
Operating cash flow was $0.26B (down 8% year over year), 2528% of net income including minority interests. Non-cash charges added back $0.05B of depreciation and amortization and $2.7M of share-based compensation. Working capital and other items added $0.20B. Capital expenditures of $0.03B left free cash flow of $0.23B.
Quarterly history
| Quarter | Form | Filed | Revenue | Y/Y | Op. margin | Net earnings | Op. cash flow |
|---|---|---|---|---|---|---|---|
| Q3 2026 | 10-Q | Oct 29, 2026 | $1.8B | +23% | 12.7% | $3.2M | $263M |
| Q2 2026 | 10-Q | Jul 30, 2026 | $1.5B | +29% | 8.7% | −$272M | $172M |
| Q1 2026 | 10-Q | Apr 30, 2026 | $912M | +30% | -3.4% | −$36.4M | −$30.9M |
| Q4 2025 | 10-K | Feb 13, 2026 | $1.2B | +19% | 6.4% | $52.0M | $179M |
| Q3 2025 | 10-Q | Nov 6, 2025 | $1.4B | +12% | 10.0% | $103M | $284M |
| Q2 2025 | 10-Q | Aug 7, 2025 | $1.1B | +4% | 9.2% | $71.7M | $1.8M |
| Q1 2025 | 10-Q | May 1, 2025 | $700M | +4% | -5.7% | −$28.3M | $3.6M |
Charts
Interactive views
The same charts as the app — open one to draw it.
💵Where each $1 goesinteractive
Loading the interactive chart…
🌏Named in Asian annual reportsinteractive
Loading the interactive chart…
🔄Rotation against the market and its industry (RRG)interactive
Loading the interactive chart…
🔍Earnings qualityinteractive
Loading the interactive chart…
⚖️Fair value by methodinteractive
Loading the interactive chart…
🔭Outlook & guidanceinteractive
Loading the interactive chart…
📈Investments: gains and what it boughtinteractive
Loading the interactive chart…
🏭Its industry’s money flow (input-output)interactive
Loading the interactive chart…
About Granite Construction
Granite Construction Company was incorporated in 1922. In 1990, Granite Construction Incorporated was formed as the holding company for Granite Construction Company and its wholly-owned and consolidated subsidiaries and was incorporated in Delaware. Unless otherwise indicated, the terms “we,” “us,” “our,” “Company” and “Granite” refer to Granite Construction Incorporated and its wholly-owned and consolidated subsidiaries. We deliver infrastructure solutions for public and private clients primarily in the United States. We are one of the largest diversified, vertically integrated civil contractors and construction materials producers in the United States.
In its own words, from its 10-K, filed Feb 13, 2026.
Granite Construction against its Heavy Construction Other Than Bldg Const - Contractors peers
The largest companies of the same SEC industry, each at its latest quarter. Revenue growth: +23% against the peers' median +28%. Operating margin: 12.7% against the peers' median 7.3%.
| Company | Quarter | Revenue | Y/Y | Op. margin |
|---|---|---|---|---|
| GVA Granite Construction | Q3 2026 | $1.8B | +23% | 12.7% |
| J Jacobs Solutions | Q3 FY26 | $4.1B | +34% | 7.0% |
| FLR Fluor | Q3 2026 | $3.7B | +10% | 6.0% |
| KBR KBR | Q3 2026 | $2.0B | +5% | 9.2% |
| STRL Sterling Infrastructure | Q3 2026 | $1.6B | +127% | 19.6% |
| ROAD Construction Partners | Q3 FY26 | $999M | +28% | 10.9% |
| MWH Solv Energy | Q2 2026 | $951M | +78% | 7.3% |
| BYOP KiNRG | Q2 2026 | $369M | — | 4.6% |
| ORN Orion Group Holdings | Q3 2026 | $256M | +14% | 3.3% |
Source: Granite Construction 10-Q on SEC EDGAR · CIK 861459 · Heavy Construction Other Than Bldg Const - Contractors
Guidance and outlook
13F: who owns GVA and who is buying
More on GVA
- How Granite Construction makes money: revenue by segment
- Granite Construction next earnings date and what analysts expect
- Granite Construction stock forecast, price target and fair value
- Who owns Granite Construction stock: holders, funds and Congress trades
- Granite Construction guidance and outlook
- Is Granite Construction a takeover target? LBO and rumors
- Granite Construction recalls, complaints and regulation
History
Every quarter: Q3 2026 results · Q2 2026 results · Q1 2026 results · Q4 2025 results · Q3 2025 results · Q2 2025 results · Q1 2025 results
- Granite Construction guidance history: guided vs reported
- Granite Construction gross margin by quarter
- Granite Construction operating margin by quarter
- Granite Construction net income by quarter
- Granite Construction free cash flow by quarter
- Granite Construction capital expenditures by quarter
- Granite Construction Construction revenue by quarter
- Granite Construction Materials revenue by quarter
Compare GVA with
- Granite Construction vs Jacobs Solutions (GVA vs J)
- Granite Construction vs Fluor (GVA vs FLR)
- Granite Construction vs KBR (GVA vs KBR)
- Granite Construction vs Sterling Infrastructure (GVA vs STRL)
- Granite Construction vs Construction Partners (GVA vs ROAD)
- Granite Construction vs Solv Energy (GVA vs MWH)