Filing Flows › Consumer Discretionary › lululemon athletica (LULU)
lululemon athletica (LULU) earnings and revenue breakdown
Latest: Q2 FY27 · 10-Q filed Sep 3, 2026 · lululemon athletica (LULU) Q2 FY27 earnings results →
Q2 FY27 Revenue down 4% year over year to $2.4B · 14¢ of every $1 of revenue kept as net profit · operating margin 18.8%
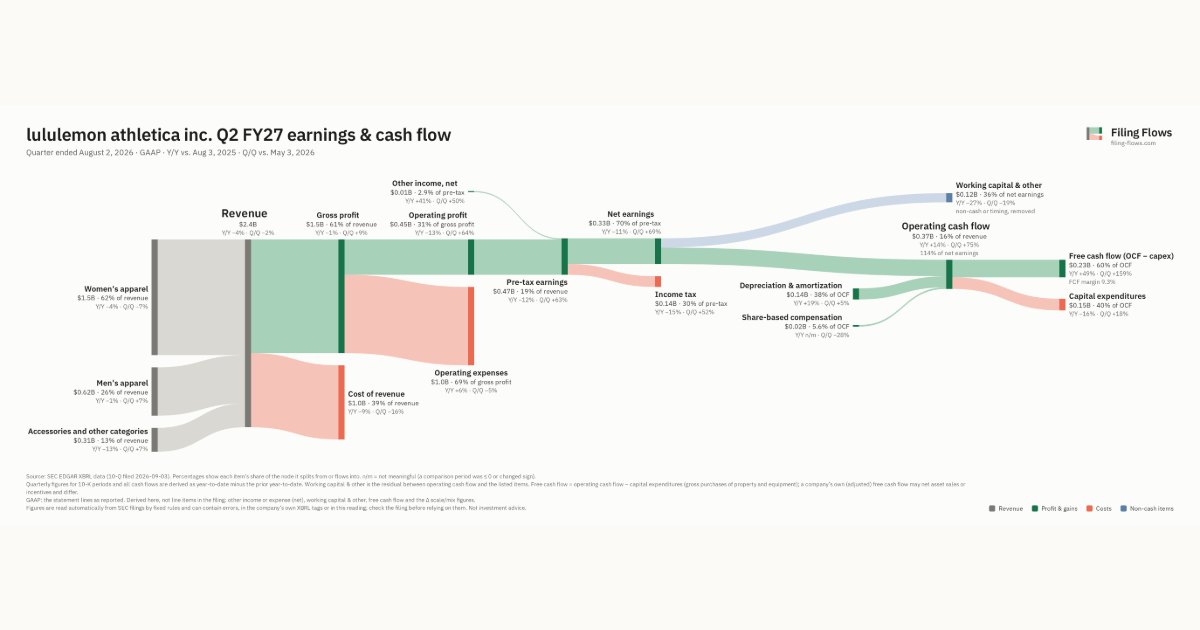
lululemon athletica made $2.4B in Q2 FY27 (-4% Y/Y): Women's apparel $1.5B, Men's apparel $621M, Accessories and other categories $306M. Operating margin 18.8%, net earnings $329M. See where every dollar goes — costs, profit and cash — as a Sankey from the 10-Q filed Sep 3, 2026.
Drawing the Sankey…
Open the interactive Sankey → click any line for what the company wrote about it, compare Y/Y and Q/Q, export as PNG or PDF
What changed this quarter
Revenue was $2.4B in Q2 FY27, down 4% year over year and down 2% from the previous quarter. Women's apparel was the largest line at 62% of revenue. Women's apparel lost $0.06B year over year (down 4%), 54% of the total change.
Gross margin was 60.5%, up 2.0 points from Q2 FY26. Operating profit was $0.45B, a 18.8% margin (down 2.0 points year over year). Operating expenses grew 6% against a revenue fall of 4%. Net earnings were $0.33B, down 11% year over year. The effective tax rate was 29.6%.
Operating cash flow was $0.37B (up 14% year over year), 114% of net earnings. Non-cash charges added back $0.14B of depreciation and amortization and $0.02B of share-based compensation. Working capital and other items used $0.12B. Capital expenditures of $0.15B left free cash flow of $0.23B.
Quarterly history
| Quarter | Form | Filed | Revenue | Y/Y | Op. margin | Net earnings | Op. cash flow |
|---|---|---|---|---|---|---|---|
| Q2 FY27 | 10-Q | Sep 3, 2026 | $2.4B | -4% | 18.8% | $329M | $375M |
| Q1 FY27 | 10-Q | Jun 4, 2026 | $2.5B | +4% | 11.2% | $195M | $214M |
| Q4 FY26 | 10-K | Mar 17, 2026 | $3.6B | +0.8% | 22.3% | $587M | $1.1B |
| Q3 FY26 | 10-Q | Dec 11, 2025 | $2.6B | +7% | 17.0% | $307M | $250M |
| Q2 FY26 | 10-Q | Sep 4, 2025 | $2.5B | +6% | 20.7% | $371M | $329M |
| Q1 FY26 | 10-Q | Jun 5, 2025 | $2.4B | +7% | 18.5% | $315M | −$119M |
| Q4 FY25 | 10-K | Mar 27, 2025 | $3.6B | +13% | 28.9% | $748M | $1.4B |
Charts
Interactive views
The same charts as the app — open one to draw it.
💵Where each $1 goesinteractive
Loading the interactive chart…
🌏Named in Asian annual reportsinteractive
Loading the interactive chart…
🔄Rotation against the market and its industry (RRG)interactive
Loading the interactive chart…
🔍Earnings qualityinteractive
Loading the interactive chart…
⚖️Fair value by methodinteractive
Loading the interactive chart…
🔭Outlook & guidanceinteractive
Loading the interactive chart…
📈Investments: gains and what it boughtinteractive
Loading the interactive chart…
🏭Its industry’s money flow (input-output)interactive
Loading the interactive chart…
About lululemon athletica
lululemon athletica inc. is principally a designer, distributor, and retailer of technical athletic apparel, footwear, and accessories. Our vision is to create transformative products and experiences that build meaningful connections, unlocking greater possibility and wellbeing for all. Since our inception, we have fostered a distinctive corporate culture; we promote a set of core values in our business which include taking personal responsibility, acting with courage, valuing connection and inclusion, and choosing to have fun. These core values attract passionate and motivated employees who are driven to achieve personal and professional goals, and share our purpose "to elevate human potential by helping people feel their best."
In its own words, from its 10-K, filed Mar 17, 2026.
lululemon athletica against its Apparel & Other Finishd Prods of Fabrics & Similar Matl peers
The largest companies of the same SEC industry, each at its latest quarter. Revenue growth: -4% against the peers' median +2%. Operating margin: 18.8% against the peers' median 7.4%.
| Company | Quarter | Revenue | Y/Y | Op. margin |
|---|---|---|---|---|
| LULU lululemon athletica | Q2 FY27 | $2.4B | -4% | 18.8% |
| LEVI Levi Strauss | Q3 FY26 | $1.6B | +4% | 13.8% |
| UAA Under Armour | Q2 FY27 | $1.2B | -7% | 1.2% |
| COLM Columbia Sportswear | Q3 2026 | $963M | +2% | 11.4% |
| CRI Carter's | Q3 2026 | $752M | -0.7% | 7.4% |
| GIII G III Apparel Group | Q2 FY27 | $554M | -10% | 2.0% |
| FIGS Figs | Q3 2026 | $191M | +26% | 11.6% |
| SGC Superior Group of Companies | Q2 2026 | $148M | +3% | 0.8% |
| JRSH Jerash Holdings (US) | Q1 FY27 | $50.2M | +27% | 5.2% |
Source: lululemon athletica 10-Q on SEC EDGAR · CIK 1397187 · Apparel & Other Finishd Prods of Fabrics & Similar Matl
Guidance and outlook
13F: who owns LULU and who is buying
More on LULU
History
Every quarter: Q2 FY27 results · Q1 FY27 results · Q4 FY26 results · Q3 FY26 results · Q2 FY26 results · Q1 FY26 results · Q4 FY25 results
- lululemon athletica guidance history: guided vs reported
- lululemon athletica gross margin by quarter
- lululemon athletica operating margin by quarter
- lululemon athletica net income by quarter
- lululemon athletica free cash flow by quarter
- lululemon athletica capital expenditures by quarter
- lululemon athletica Women's apparel revenue by quarter
- lululemon athletica Men's apparel revenue by quarter
- lululemon athletica Accessories and other categories revenue by quarter