Filing Flows › Industrials › Lyft (LYFT)
Lyft (LYFT) earnings and revenue breakdown
Latest: Q3 2026 · 10-Q filed Nov 6, 2026 · Lyft (LYFT) Q3 2026 earnings results →
Q3 2026 Revenue up 8% year over year to $1.8B · 1¢ of every $1 of revenue lost · operating margin -1.1%
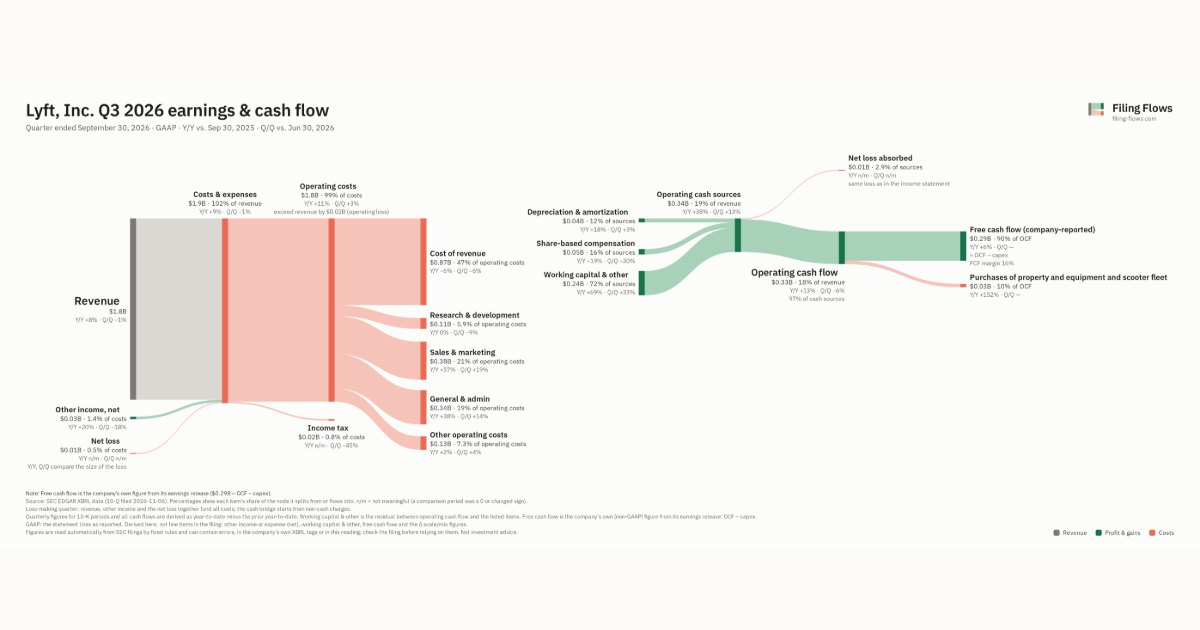
Lyft made $1.8B in Q3 2026 (+8% Y/Y). Operating margin -1.1%, net loss $9.7M. See where every dollar goes — costs, profit and cash — as a Sankey from the 10-Q filed Nov 6, 2026.
Drawing the Sankey…
Open the interactive Sankey → click any line for what the company wrote about it, compare Y/Y and Q/Q, export as PNG or PDF
What changed this quarter
Revenue was $1.8B in Q3 2026, up 8% year over year and down 1% from the previous quarter.
Operating costs exceeded revenue by $0.02B, an operating margin of -1.1%. Total costs grew 11% against revenue growth of 8%. The fastest-growing cost line was Sales & marketing (+57%). The quarter ended with a net loss of $0.01B, after a profit of $0.05B the previous quarter. Non-operating items added $0.03B, 431% of pre-tax earnings, so the bottom line overstates operating performance.
Operating cash flow was $0.33B (up 13% year over year). Non-cash charges added back $0.04B of depreciation and amortization and $0.05B of share-based compensation. Working capital and other items added $0.24B. After purchases of property and equipment and scooter fleet ($0.03B), free cash flow as the company reports it was $0.29B.
Quarterly history
| Quarter | Form | Filed | Revenue | Y/Y | Op. margin | Net earnings | Op. cash flow |
|---|---|---|---|---|---|---|---|
| Q3 2026 | 10-Q | Nov 6, 2026 | $1.8B | +8% | -1.1% | −$9.7M | $328M |
| Q2 2026 | 10-Q | Aug 7, 2026 | $1.8B | +16% | 2.6% | $50.3M | $350M |
| Q1 2026 | 10-Q | May 8, 2026 | $1.7B | +14% | -0.3% | $14.2M | $308M |
| Q4 2025 | 10-K | Feb 11, 2026 | $1.6B | +3% | -11.6% | $2.8B | $246M |
| Q3 2025 | 10-Q | Nov 5, 2025 | $1.7B | +11% | 1.4% | $46.1M | $291M |
| Q2 2025 | 10-Q | Aug 7, 2025 | $1.6B | +11% | 0.2% | $40.3M | $344M |
| Q1 2025 | 10-Q | May 9, 2025 | $1.5B | +14% | -2.0% | $2.6M | $287M |
Charts
Interactive views
The same charts as the app — open one to draw it.
💵Where each $1 goesinteractive
Loading the interactive chart…
🌏Named in Asian annual reportsinteractive
Loading the interactive chart…
🔄Rotation against the market and its industry (RRG)interactive
Loading the interactive chart…
🔍Earnings qualityinteractive
Loading the interactive chart…
⚖️Fair value by methodinteractive
Loading the interactive chart…
🔭Outlook & guidanceinteractive
Loading the interactive chart…
📈Investments: gains and what it boughtinteractive
Loading the interactive chart…
🏭Its industry’s money flow (input-output)interactive
Loading the interactive chart…
Customers and suppliers named in filings
Buys from
About Lyft
Lyft, Inc. (the “Company” or “Lyft”) operates as a global mobility platform offering a mix of rideshare, taxis, private hire vehicles, executive chauffeur services, car sharing, bikes and scooters. Our established, scaled network of users is brought together by our robust technology platform (the “Lyft Platform”) that powers rides and connections every day. Our Lyft mobile application (“Lyft App”) connect riders with drivers for on-demand ride services and supports a variety of other multimodal solutions. Substantially all of our revenue is generated from our ridesharing marketplace that connects drivers and riders. We collect service fees and commissions from drivers for their use of our ridesharing marketplace.
In its own words, from its 10-K, filed Feb 11, 2026.
Lyft against its Services-Business Services, NEC peers
The largest companies of the same SEC industry, each at its latest quarter. Revenue growth: +8% against the peers' median +10%. Operating margin: -1.1% against the peers' median 9.8%.
| Company | Quarter | Revenue | Y/Y | Op. margin |
|---|---|---|---|---|
| LYFT Lyft | Q3 2026 | $1.8B | +8% | -1.1% |
| ACN Accenture | Q4 FY26 | $18.7B | +6% | 15.3% |
| UBER Uber Technologies | Q3 2026 | $14.8B | +10% | 9.8% |
| V Visa | Q4 FY26 | $12.1B | +13% | 59.8% |
| MELI MercadoLibre | Q3 2026 | $10.8B | +45% | 6.3% |
| MA Mastercard | Q3 2026 | $9.8B | +14% | 59.8% |
| PYPL PayPal Holdings | Q3 2026 | $8.6B | +2% | 16.3% |
| FISV Fiserv | Q3 2026 | $5.2B | -1% | -105.7% |
| DASH DoorDash | Q3 2026 | $4.6B | +34% | 9.6% |
Source: Lyft 10-Q on SEC EDGAR · CIK 1759509 · Services-Business Services, NEC
Guidance and outlook
13F: who owns LYFT and who is buying
More on LYFT
History
Every quarter: Q3 2026 results · Q2 2026 results · Q1 2026 results · Q4 2025 results · Q3 2025 results · Q2 2025 results · Q1 2025 results