Filing Flows › Technology › Nebius Group N.V. (NBIS)
Nebius Group N.V. (NBIS) earnings and revenue breakdown
Latest: FY2025 · 20-F filed Apr 30, 2026 · Nebius Group N.V. (NBIS) FY2025 earnings results →
FY2025 Revenue up 479% year over year to $530M · 16¢ of every $1 of revenue kept as net profit · operating margin -115.5%
Nebius Group N.V. made $530M in FY2025 (+479% Y/Y). Operating margin -115.5%, net earnings $82.5M. See where every dollar goes — costs, profit and cash — as a Sankey from the 20-F filed Apr 30, 2026.
Drawing the Sankey…
Open the interactive Sankey → click any line for what the company wrote about it, compare Y/Y and Q/Q, export as PNG or PDF
What changed this quarter
Revenue was $529.8M in FY2025, up 479% year over year.
Operating costs exceeded revenue by $611.7M, an operating margin of -115.5%. Total costs grew 132% against revenue growth of 479%. The fastest-growing cost line was Other operating costs (+442%). Net earnings were $82.5M. The effective tax rate was 4.6%. Non-operating items added $698.2M, 807% of pre-tax earnings, so the bottom line overstates operating performance.
Operating cash flow was $384.8M (up 57% year over year), 466% of net earnings. Non-cash charges added back $417.9M of depreciation and amortization and $83.2M of share-based compensation. Working capital and other items used $198.8M. Capital expenditures of $4,066.0M exceeded it, leaving free cash flow of −$3,681.2M.
Quarterly history
| Quarter | Form | Filed | Revenue | Y/Y | Op. margin | Net earnings | Op. cash flow |
|---|---|---|---|---|---|---|---|
| FY2025 | 20-F | Apr 30, 2026 | $530M | +479% | -115.5% | $82.5M | $385M |
| FY2024 | 20-F | Apr 30, 2025 | $118M | -99% | -375.1% | −$641M | $246M |
Charts
In supply chains and themes
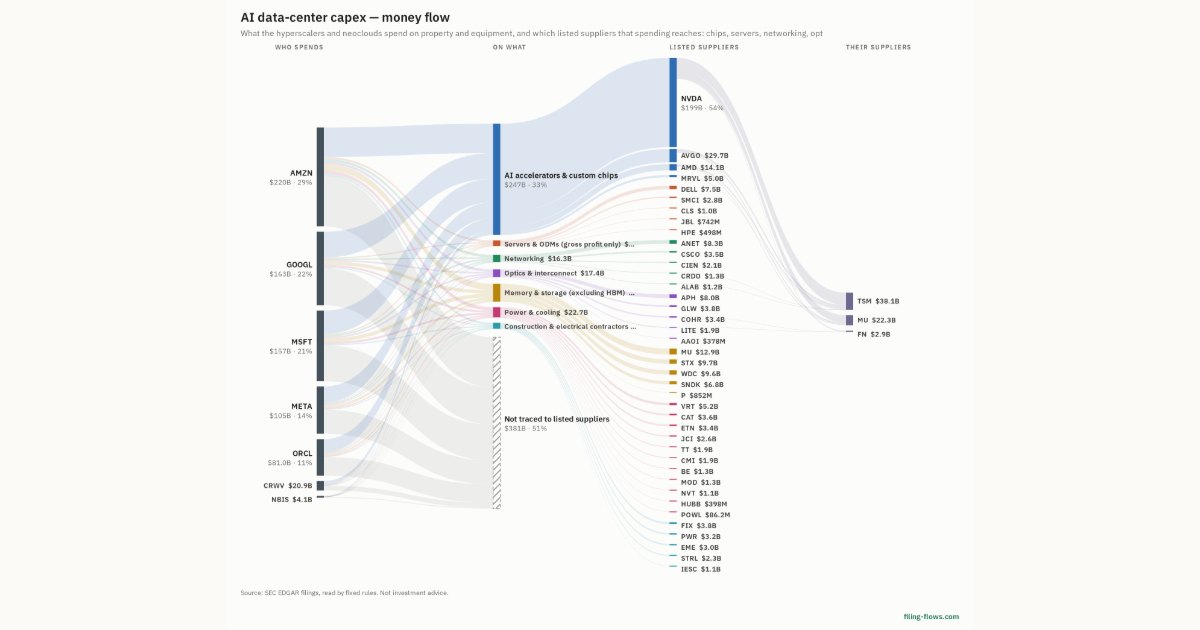 AI data-center capex · buyer
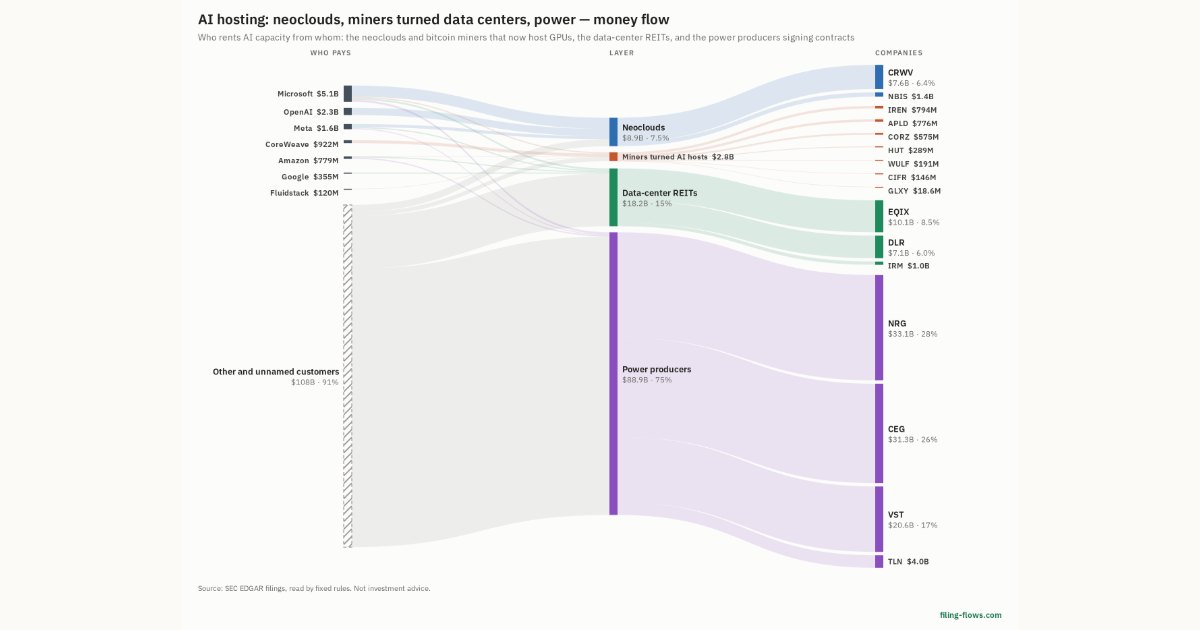 AI hosting: neoclouds, miners turned data centers, power · Neoclouds
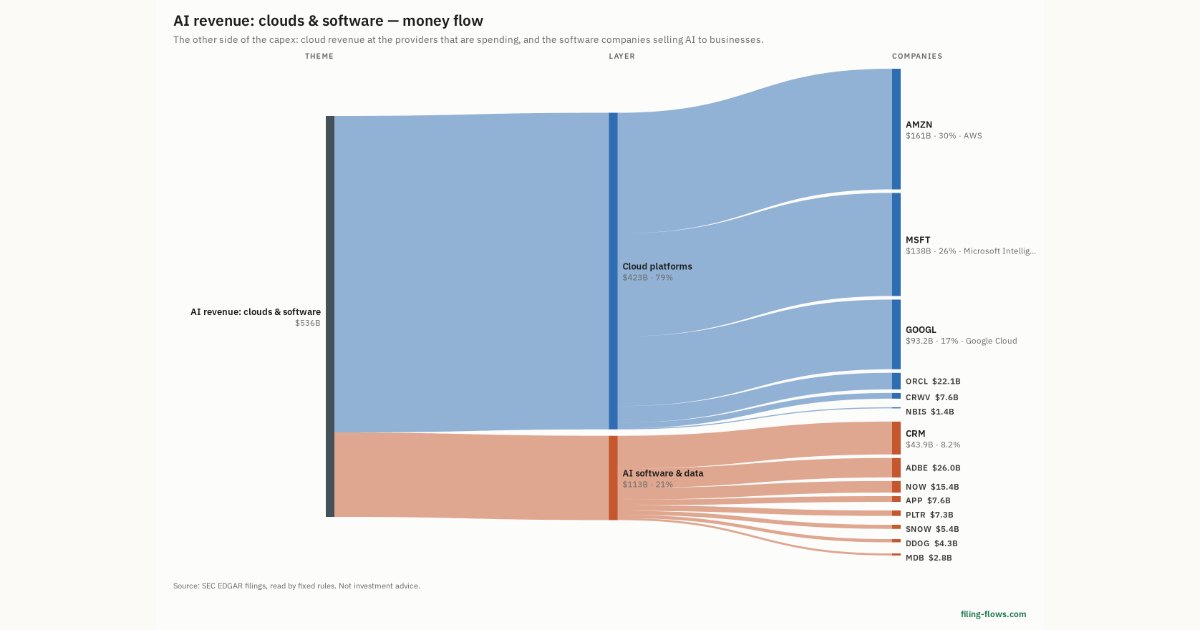 AI revenue: clouds & software · Cloud platforms
Interactive views
The same charts as the app — open one to draw it.
💵Where each $1 goesinteractive
Loading the interactive chart…
🌏Named in Asian annual reportsinteractive
Loading the interactive chart…
🔄Rotation against the market and its industry (RRG)interactive
Loading the interactive chart…
🔍Earnings qualityinteractive
Loading the interactive chart…
⚖️Fair value by methodinteractive
Loading the interactive chart…
🔭Outlook & guidanceinteractive
Loading the interactive chart…
📈Investments: gains and what it boughtinteractive
Loading the interactive chart…
🏭Its industry’s money flow (input-output)interactive
Loading the interactive chart…
Customers and suppliers named in filings
Buys from
About Nebius Group N.V.
Nebius, the AI cloud company, is building the full-stack platform for developers and companies to take charge of their AI future — from data and model training to production deployment. Founded on deep in-house technological expertise and operating at scale with a rapidly expanding global footprint, Nebius serves startups and enterprises building AI products, agents, and services worldwide. Nebius Group also includes Avride (a leading developer of autonomous vehicles and delivery robots) and TripleTen (a leading edtech platform reskilling people for careers in tech), and owns equity stakes in other companies including ClickHouse and Toloka.
In its own words, from its 6-K, filed Aug 12, 2026.
Nebius Group N.V. against its Services-Computer Programming, Data Processing, Etc. peers
The largest companies of the same SEC industry, each at its latest quarter. Revenue growth: +479% against the peers' median +25%. Operating margin: -115.5% against the peers' median 19.1%.
| Company | Quarter | Revenue | Y/Y | Op. margin |
|---|---|---|---|---|
| NBIS Nebius Group N.V. | FY2025 | $530M | +479% | -115.5% |
| GOOGL Alphabet | Q3 2026 | $127.6B | +25% | 31.8% |
| META Meta Platforms | Q3 2026 | $64.6B | +26% | 20.1% |
| SPCX Space Exploration Technologies | Q3 2026 | $14.6B | +161% | 19.1% |
| FLUT Flutter Entertainment | Q3 2026 | $3.9B | +2% | -30.7% |
| APP AppLovin | Q3 2026 | $2.2B | +56% | 78.2% |
| SNAP Snap | Q3 2026 | $1.7B | +14% | 4.5% |
| ZM Zoom Communications | Q2 FY27 | $1.3B | +5% | 24.6% |
| PINS Pinterest | Q3 2026 | $1.2B | +12% | 2.6% |
Source: Nebius Group N.V. 20-F on SEC EDGAR · CIK 1513845 · Services-Computer Programming, Data Processing, Etc.
More on NBIS
History
Every quarter: FY2025 results · FY2024 results