Filing Flows › Materials › Newell Brands (NWL)
Newell Brands (NWL) earnings and revenue breakdown
Latest: Q3 2026 · 10-Q filed Oct 30, 2026 · Newell Brands (NWL) Q3 2026 earnings results →
Q3 2026 Revenue up 4% year over year to $1.9B · 4¢ of every $1 of revenue lost · operating margin 1.4%
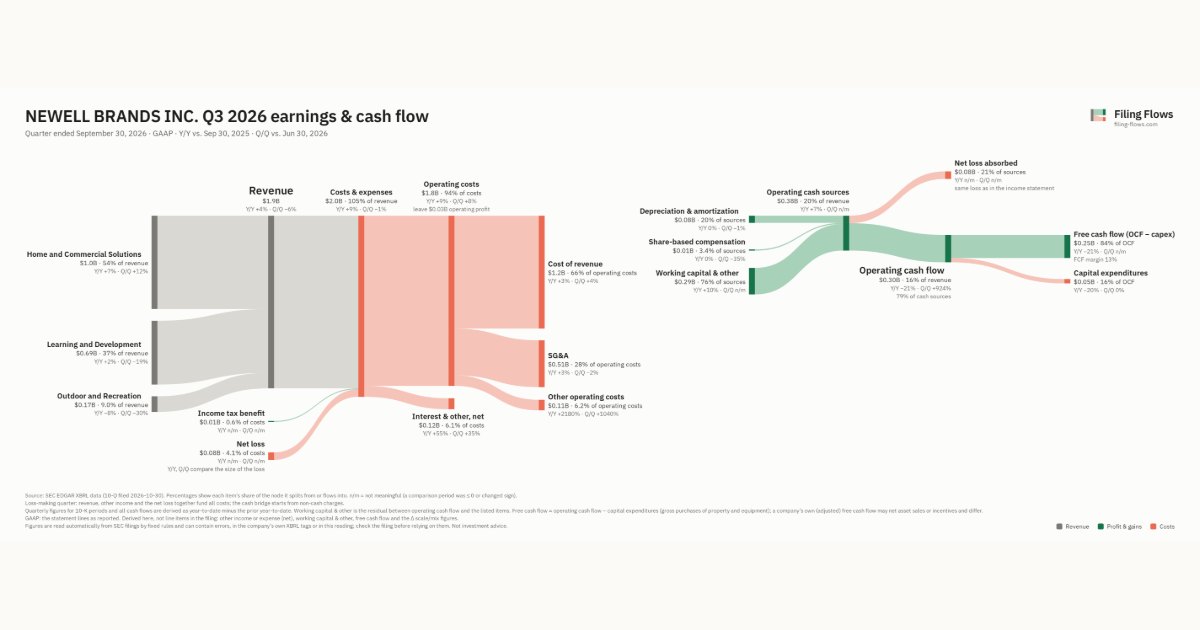
Newell Brands made $1.9B in Q3 2026 (+4% Y/Y): Home and Commercial Solutions $1.0B, Learning and Development $692M, Outdoor and Recreation $169M. Operating margin 1.4%, net loss $81.0M. See where every dollar goes — costs, profit and cash — as a Sankey from the 10-Q filed Oct 30, 2026.
Drawing the Sankey…
Open the interactive Sankey → click any line for what the company wrote about it, compare Y/Y and Q/Q, export as PNG or PDF
What changed this quarter
Revenue was $1.9B in Q3 2026, up 4% year over year and down 6% from the previous quarter. Home and Commercial Solutions was the largest line at 54% of revenue. Home and Commercial Solutions added $0.07B year over year (up 7%), 104% of the total change. Outdoor and Recreation declined 8%.
Gross margin was 34.7%, up 0.5 points from Q3 2025. Operating profit was $0.03B, a 1.4% margin (down 5.1 points year over year). Operating profit fell $0.09B even though revenue rose $0.07B versus Q3 2025, so costs grew faster than sales. Operating expenses grew 25% against revenue growth of 4%. The fastest-growing cost line was Other operating costs (+2180%). The quarter ended with a net loss of $0.08B, after a profit of $0.11B the previous quarter. Net interest and other expense of $0.12B was the main reason.
Operating cash flow was $0.30B (down 21% year over year). Non-cash charges added back $0.08B of depreciation and amortization and $0.01B of share-based compensation. Working capital and other items added $0.29B. Capital expenditures of $0.05B left free cash flow of $0.25B.
Quarterly history
| Quarter | Form | Filed | Revenue | Y/Y | Op. margin | Net earnings | Op. cash flow |
|---|---|---|---|---|---|---|---|
| Q3 2026 | 10-Q | Oct 30, 2026 | $1.9B | +4% | 1.4% | −$81.0M | $297M |
| Q2 2026 | 10-Q | Jul 31, 2026 | $2.0B | +3% | 14.2% | $106M | $29.0M |
| Q1 2026 | 10-Q | May 1, 2026 | $1.5B | -1% | 2.2% | −$33.0M | −$233M |
| Q4 2025 | 10-K | Feb 13, 2026 | $1.9B | -3% | -14.3% | −$315M | $161M |
| Q3 2025 | 10-Q | Oct 31, 2025 | $1.8B | -7% | 6.6% | $21.0M | $374M |
| Q2 2025 | 10-Q | Aug 1, 2025 | $1.9B | -5% | 8.8% | $46.0M | −$58.0M |
| Q1 2025 | 10-Q | Apr 30, 2025 | $1.6B | -5% | 1.3% | −$37.0M | −$213M |
Charts
Interactive views
The same charts as the app — open one to draw it.
💵Where each $1 goesinteractive
Loading the interactive chart…
🌏Named in Asian annual reportsinteractive
Loading the interactive chart…
🔄Rotation against the market and its industry (RRG)interactive
Loading the interactive chart…
🔍Earnings qualityinteractive
Loading the interactive chart…
⚖️Fair value by methodinteractive
Loading the interactive chart…
🔭Outlook & guidanceinteractive
Loading the interactive chart…
📈Investments: gains and what it boughtinteractive
Loading the interactive chart…
🏭Its industry’s money flow (input-output)interactive
Loading the interactive chart…
Customers and suppliers named in filings
Sells to
- AMZN — 17% of its revenue · Stated in 10-K (sentence) · source
- WMT — 13% of its revenue · Stated in 10-K (sentence) · source
About Newell Brands
“Newell Brands” or the “Company” refers to Newell Brands Inc. alone or with its wholly owned subsidiaries, as the context requires. When this report uses the words “we,” “us” or “our,” it refers to the Company and its subsidiaries unless the context otherwise requires. The Company was founded in Ogdensburg, New York in 1903 and is incorporated in Delaware. The Company makes available free of charge on or through its website its annual reports on Form 10-K, quarterly reports on Form 10-Q, current reports on Form 8-K, and amendments to those reports filed or furnished pursuant to Section 13(a) or 15(d) of the Securities Exchange Act of 1934 (the “Exchange Act”) as soon as practicable after the Company files them with, or furnishes them to, the United States Securities and Exchange Commission (“SEC”). The Company’s website can be found at www.newellbrands.com .
In its own words, from its 10-K, filed Feb 13, 2026.
Newell Brands against its Plastics Products, NEC peers
The largest companies of the same SEC industry, each at its latest quarter. Revenue growth: +4% against the peers' median +12%. Operating margin: 1.4% against the peers' median 13.0%.
| Company | Quarter | Revenue | Y/Y | Op. margin |
|---|---|---|---|---|
| NWL Newell Brands | Q3 2026 | $1.9B | +4% | 1.4% |
| ATR Aptargroup | Q3 2026 | $1.0B | +6% | 13.2% |
| ENTG Entegris | Q3 2026 | $1.0B | +25% | 22.9% |
| AWI Armstrong World Industries | Q3 2026 | $476M | +12% | 27.6% |
| SWIM Latham Group | Q3 2026 | $182M | +12% | 13.0% |
| MYE Myers Industries | Q3 2026 | $171M | +8% | 8.7% |
| KRT Karat Packaging | Q3 2026 | $135M | +8% | 3.6% |
| CMT Core Molding Technologies | Q3 2026 | $90.2M | +54% | 1.8% |
Source: Newell Brands 10-Q on SEC EDGAR · CIK 814453 · Plastics Products, NEC
Guidance and outlook
13F: who owns NWL and who is buying
More on NWL
- How Newell Brands makes money: revenue by segment
- Newell Brands next earnings date and what analysts expect
- Newell Brands stock forecast, price target and fair value
- Who owns Newell Brands stock: holders, funds and Congress trades
- Newell Brands guidance and outlook
- Is Newell Brands a takeover target? LBO and rumors
- Newell Brands recalls, complaints and regulation
History
Every quarter: Q3 2026 results · Q2 2026 results · Q1 2026 results · Q4 2025 results · Q3 2025 results · Q2 2025 results · Q1 2025 results
- Newell Brands guidance history: guided vs reported
- Newell Brands gross margin by quarter
- Newell Brands operating margin by quarter
- Newell Brands net income by quarter
- Newell Brands free cash flow by quarter
- Newell Brands capital expenditures by quarter
- Newell Brands Home and Commercial Solutions revenue by quarter
- Newell Brands Learning and Development revenue by quarter
- Newell Brands Outdoor and Recreation revenue by quarter