Filing Flows › Financials › Principal Financial Group (PFG)
Principal Financial Group (PFG) earnings and revenue breakdown
Latest: Q3 2026 · 10-Q filed Oct 29, 2026 · Principal Financial Group (PFG) Q3 2026 earnings results →
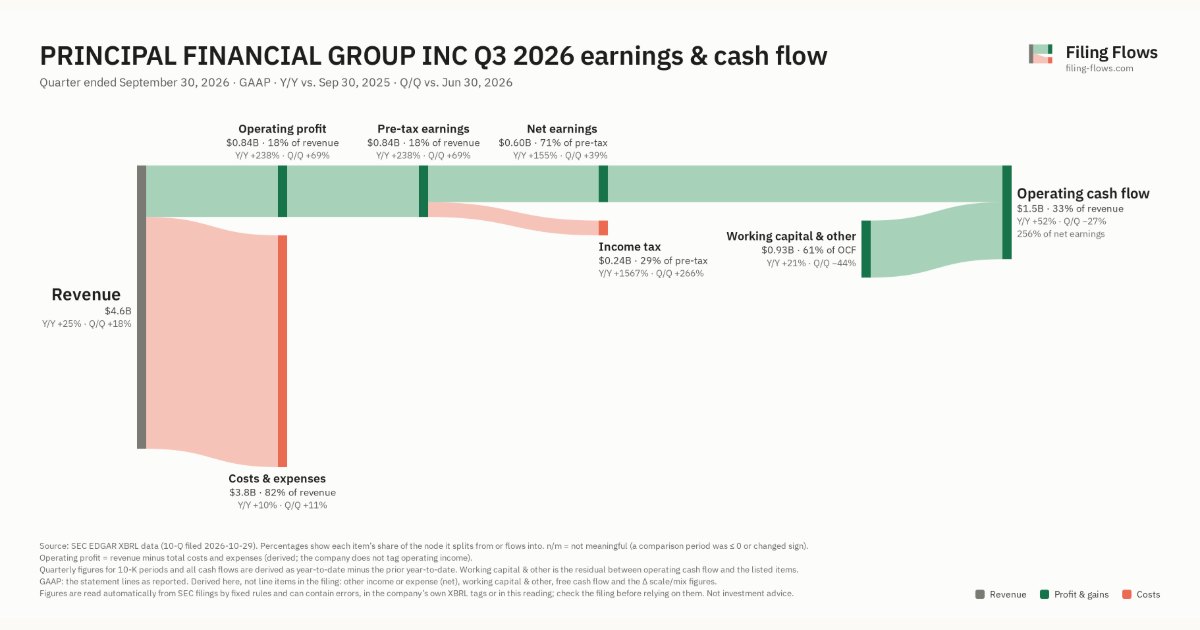
Q3 2026 Revenue up 25% year over year to $4.6B · 14¢ of every $1 of revenue kept as net profit · operating margin 18.2%
Principal Financial Group made $4.6B in Q3 2026 (+25% Y/Y). Operating margin 18.2%, net earnings $632M. See where every dollar goes — costs, profit and cash — as a Sankey from the 10-Q filed Oct 29, 2026.
Drawing the Sankey…
Open the interactive Sankey → click any line for what the company wrote about it, compare Y/Y and Q/Q, export as PNG or PDF
What changed this quarter
Revenue was $4.6B in Q3 2026, up 25% year over year and up 18% from the previous quarter.
Operating profit was $0.84B, a 18.2% margin (up 11.4 points year over year). Of the extra revenue versus Q3 2025, 63% reached operating profit, above the 7% margin then. Total costs grew 10% against revenue growth of 25%. Net earnings were $0.63B, up 196% year over year ($0.60B including minority interests, which bore $0.03B of losses). The effective tax rate was 28.8%.
Operating cash flow was $1.5B (up 52% year over year), 256% of net income including minority interests. Working capital and other items added $0.93B.
Quarterly history
| Quarter | Form | Filed | Revenue | Y/Y | Op. margin | Net earnings | Op. cash flow |
|---|---|---|---|---|---|---|---|
| Q3 2026 | 10-Q | Oct 29, 2026 | $4.6B | +25% | 18.2% | $632M | $1.5B |
| Q2 2026 | 10-Q | Jul 29, 2026 | $3.9B | +6% | 12.7% | $403M | $2.1B |
| Q1 2026 | 10-Q | Apr 29, 2026 | $3.5B | -4% | 13.7% | $425M | $187M |
| Q4 2025 | 10-K | Feb 18, 2026 | $4.6B | -4% | 13.9% | $517M | $1.7B |
| Q3 2025 | 10-Q | Oct 29, 2025 | $3.7B | +22% | 6.7% | $214M | $1.0B |
| Q2 2025 | 10-Q | Jul 30, 2025 | $3.7B | -15% | 13.7% | $406M | $812M |
| Q1 2025 | 10-Q | Apr 30, 2025 | $3.7B | -9% | 0.8% | $48.1M | $977M |
Charts
Interactive views
The same charts as the app — open one to draw it.
💵Where each $1 goesinteractive
Loading the interactive chart…
🌏Named in Asian annual reportsinteractive
Loading the interactive chart…
🔄Rotation against the market and its industry (RRG)interactive
Loading the interactive chart…
🔍Earnings qualityinteractive
Loading the interactive chart…
⚖️Fair value by methodinteractive
Loading the interactive chart…
🔭Outlook & guidanceinteractive
Loading the interactive chart…
📈Investments: gains and what it boughtinteractive
Loading the interactive chart…
🏭Its industry’s money flow (input-output)interactive
Loading the interactive chart…
Customers and suppliers named in filings
Sells to
- INTG · Stated in 10-K (named, share not stated) · source
- PRSI · Stated in 10-K (named, share not stated) · source
- Principal Credit Real Estate Income Trust · Stated in 10-K (named, share not stated) · source
About Principal Financial Group
Principal Financial Group, Inc. (“PFG”) is a leader in global financial services offering businesses, individuals and institutional clients a wide range of financial products and services, including retirement, asset management and workplace benefits and protection solutions through our diverse family of financial services companies. We had $1,814.6 billion in assets under administration (“AUA”), including $781.0 billion in assets under management (“AUM”) as of December 31, 2025. Our global asset management businesses serve a broad range of institutional, retirement, high net worth, and retail investors worldwide. Our focused investment teams provide diverse, long-term investment capabilities including equity, fixed income, real estate, and other alternative investments, as well as fund offerings.
In its own words, from its 10-K, filed Feb 18, 2026.
Principal Financial Group against its Accident & Health Insurance peers
The largest companies of the same SEC industry, each at its latest quarter. Revenue growth: +25% against the peers' median -9%. Operating margin: 18.2% against the peers' median 15.3%.
| Company | Quarter | Revenue | Y/Y | Op. margin |
|---|---|---|---|---|
| PFG Principal Financial Group | Q3 2026 | $4.6B | +25% | 18.2% |
| AFL Aflac | Q3 2026 | $3.3B | -31% | 15.3% |
| UNM Unum | Q3 2026 | $2.5B | -25% | -21.6% |
| CNO CNO Financial Group | Q3 2026 | $1.1B | -9% | 20.3% |
| PRCH Porch Group | Q3 2026 | $144M | +13% | 12.6% |
Source: Principal Financial Group 10-Q on SEC EDGAR · CIK 1126328 · Accident & Health Insurance
Guidance and outlook
13F: who owns PFG and who is buying
More on PFG
- How Principal Financial Group makes money: revenue by segment
- Principal Financial Group stock forecast, price target and fair value
- Who owns Principal Financial Group stock: holders, funds and Congress trades
- Principal Financial Group guidance and outlook
- Principal Financial Group recalls, complaints and regulation
History
Every quarter: Q3 2026 results · Q2 2026 results · Q1 2026 results · Q4 2025 results · Q3 2025 results · Q2 2025 results · Q1 2025 results