Filing Flows › Financials › Unum (UNM)
Unum (UNM) earnings and revenue breakdown
Latest: Q3 2026 · 10-Q filed Nov 4, 2026 · Unum (UNM) Q3 2026 earnings results →
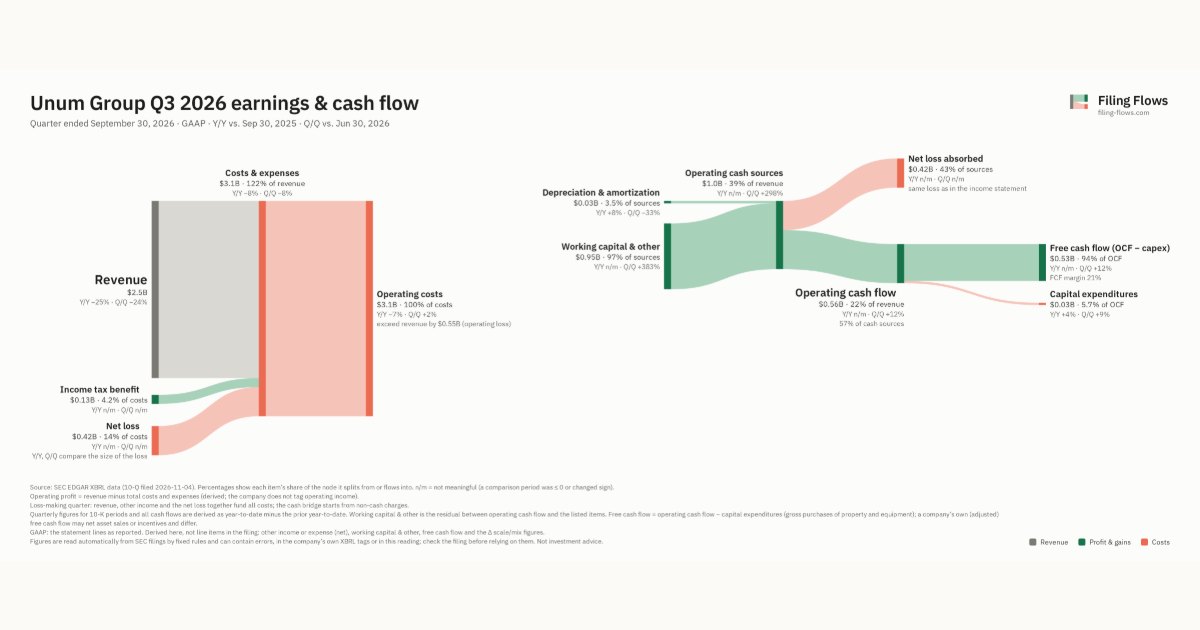
Q3 2026 Revenue down 25% year over year to $2.5B · 16¢ of every $1 of revenue lost · operating margin -21.6%
Unum made $2.5B in Q3 2026 (-25% Y/Y). Operating margin -21.6%, net loss $420M. See where every dollar goes — costs, profit and cash — as a Sankey from the 10-Q filed Nov 4, 2026.
Drawing the Sankey…
Open the interactive Sankey → click any line for what the company wrote about it, compare Y/Y and Q/Q, export as PNG or PDF
What changed this quarter
Revenue was $2.5B in Q3 2026, down 25% year over year and down 24% from the previous quarter.
Operating costs exceeded revenue by $0.55B, an operating margin of -21.6%. Total costs fell 7% while revenue fell 25%. The quarter ended with a net loss of $0.42B, after a profit of $0.26B the previous quarter.
Operating cash flow was $0.56B. Non-cash charges added back $0.03B of depreciation and amortization. Working capital and other items added $0.95B. Capital expenditures of $0.03B left free cash flow of $0.53B.
Quarterly history
| Quarter | Form | Filed | Revenue | Y/Y | Op. margin | Net earnings | Op. cash flow |
|---|---|---|---|---|---|---|---|
| Q3 2026 | 10-Q | Nov 4, 2026 | $2.5B | -25% | -21.6% | −$420M | $562M |
| Q2 2026 | 10-Q | Jul 29, 2026 | $3.4B | +0.3% | 9.8% | $257M | $504M |
| Q1 2026 | 10-Q | Apr 29, 2026 | $3.4B | +8% | 9.0% | $232M | $341M |
| Q4 2025 | 10-K | Feb 17, 2026 | $3.2B | +0.2% | 6.7% | $174M | $358M |
| Q3 2025 | 10-Q | Nov 4, 2025 | $3.4B | +5% | 1.6% | $39.7M | −$372M |
| Q2 2025 | 10-Q | Jul 30, 2025 | $3.4B | +4% | 12.4% | $336M | $348M |
| Q1 2025 | 10-Q | Apr 30, 2025 | $3.1B | -3% | 7.9% | $189M | $354M |
Charts
Interactive views
The same charts as the app — open one to draw it.
💵Where each $1 goesinteractive
Loading the interactive chart…
🌏Named in Asian annual reportsinteractive
Loading the interactive chart…
🔄Rotation against the market and its industry (RRG)interactive
Loading the interactive chart…
🔍Earnings qualityinteractive
Loading the interactive chart…
⚖️Fair value by methodinteractive
Loading the interactive chart…
🔭Outlook & guidanceinteractive
Loading the interactive chart…
📈Investments: gains and what it boughtinteractive
Loading the interactive chart…
🏭Its industry’s money flow (input-output)interactive
Loading the interactive chart…
About Unum
Unum Group, a Delaware general business corporation, and its insurance and non-insurance subsidiaries, which collectively with Unum Group we refer to as the Company, operate in the United States, the United Kingdom, Poland, and, to a limited extent, in certain other countries. The principal operating subsidiaries in the United States are Unum Life Insurance Company of America (Unum America), Provident Life and Accident Insurance Company (Provident), The Paul Revere Life Insurance Company (Paul Revere Life), Colonial Life & Accident Insurance Company, Unum Insurance Company, Starmount Life Insurance Company (Starmount), in the United Kingdom, Unum Limited, and in Poland, Unum Zycie TUiR S.A. (Unum Poland). We are a leading provider of financial protection benefits in the United States and the United Kingdom.
In its own words, from its 10-K, filed Feb 17, 2026.
Unum against its Accident & Health Insurance peers
The largest companies of the same SEC industry, each at its latest quarter. Revenue growth: -25% against the peers' median -9%. Operating margin: -21.6% against the peers' median 15.3%.
| Company | Quarter | Revenue | Y/Y | Op. margin |
|---|---|---|---|---|
| UNM Unum | Q3 2026 | $2.5B | -25% | -21.6% |
| PFG Principal Financial Group | Q3 2026 | $4.6B | +25% | 18.2% |
| AFL Aflac | Q3 2026 | $3.3B | -31% | 15.3% |
| CNO CNO Financial Group | Q3 2026 | $1.1B | -9% | 20.3% |
| PRCH Porch Group | Q3 2026 | $144M | +13% | 12.6% |
Source: Unum 10-Q on SEC EDGAR · CIK 5513 · Accident & Health Insurance
Guidance and outlook
13F: who owns UNM and who is buying
More on UNM
History
Every quarter: Q3 2026 results · Q2 2026 results · Q1 2026 results · Q4 2025 results · Q3 2025 results · Q2 2025 results · Q1 2025 results