Filing Flows › Financials › CNO Financial Group (CNO)
CNO Financial Group (CNO) earnings and revenue breakdown
Latest: Q3 2026 · 10-Q filed Nov 5, 2026 · CNO Financial Group (CNO) Q3 2026 earnings results →
Q3 2026 Revenue down 9% year over year to $1.1B · 15¢ of every $1 of revenue kept as net profit · operating margin 20.3%
CNO Financial Group made $1.1B in Q3 2026 (-9% Y/Y). Operating margin 20.3%, net earnings $161M. See where every dollar goes — costs, profit and cash — as a Sankey from the 10-Q filed Nov 5, 2026.
Drawing the Sankey…
Open the interactive Sankey → click any line for what the company wrote about it, compare Y/Y and Q/Q, export as PNG or PDF
What changed this quarter
Revenue was $1.1B in Q3 2026, down 9% year over year and down 15% from the previous quarter.
Operating profit was $0.22B, a 20.3% margin (up 6.6 points year over year). Total costs fell 16% while revenue fell 9%. Net earnings were $0.16B, up 597% year over year. The effective tax rate was 28.8%.
Operating cash flow was $0.24B (up 22% year over year), 150% of net earnings. Non-cash charges added back $0.08B of depreciation and amortization.
Quarterly history
| Quarter | Form | Filed | Revenue | Y/Y | Op. margin | Net earnings | Op. cash flow |
|---|---|---|---|---|---|---|---|
| Q3 2026 | 10-Q | Nov 5, 2026 | $1.1B | -9% | 20.3% | $161M | $242M |
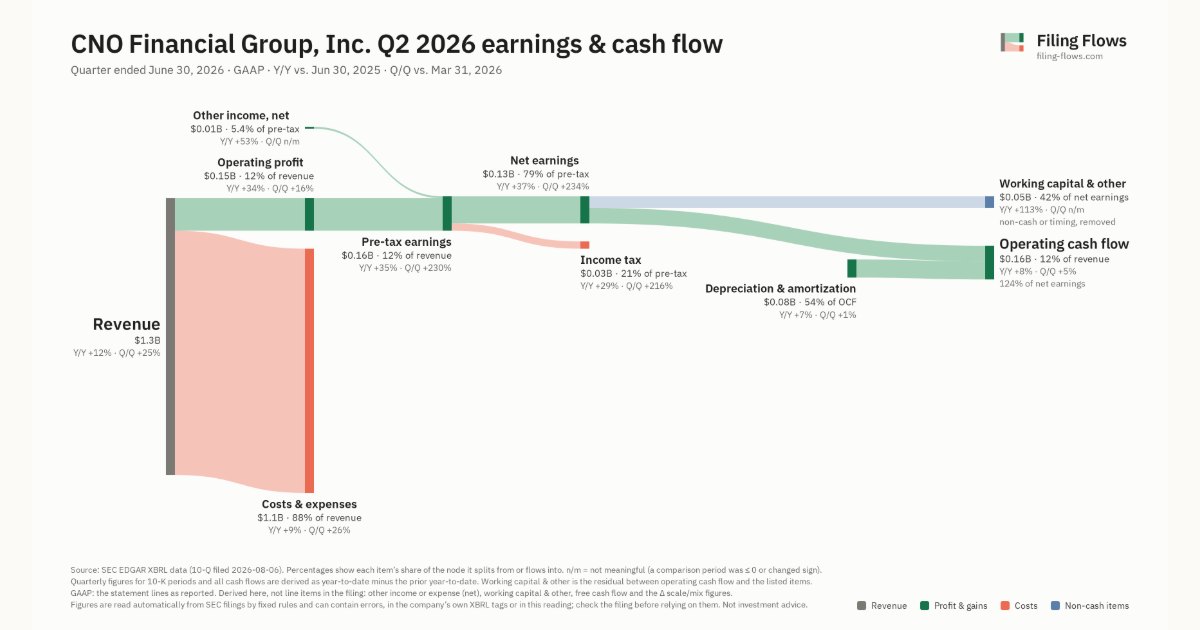
| Q2 2026 | 10-Q | Aug 6, 2026 | $1.3B | +12% | 11.7% | $126M | $157M |
| Q1 2026 | 10-Q | May 7, 2026 | $1.0B | +2% | 12.6% | $37.7M | $149M |
| Q4 2025 | 10-K | Feb 24, 2026 | $1.1B | +4% | 15.2% | $92.9M | $196M |
| Q3 2025 | 10-Q | Nov 6, 2025 | $1.2B | +5% | 13.7% | $23.1M | $198M |
| Q2 2025 | 10-Q | Aug 6, 2025 | $1.2B | +8% | 9.8% | $91.8M | $146M |
| Q1 2025 | 10-Q | May 7, 2025 | $1.0B | -13% | 10.4% | $13.7M | $137M |
Charts
Interactive views
The same charts as the app — open one to draw it.
💵Where each $1 goesinteractive
Loading the interactive chart…
🌏Named in Asian annual reportsinteractive
Loading the interactive chart…
🔄Rotation against the market and its industry (RRG)interactive
Loading the interactive chart…
🔍Earnings qualityinteractive
Loading the interactive chart…
⚖️Fair value by methodinteractive
Loading the interactive chart…
🔭Outlook & guidanceinteractive
Loading the interactive chart…
📈Investments: gains and what it boughtinteractive
Loading the interactive chart…
🏭Its industry’s money flow (input-output)interactive
Loading the interactive chart…
About CNO Financial Group
CNO is a holding company for a group of insurance companies that develop, market and administer health insurance, annuity, individual life insurance and other insurance and financial services products. The terms "CNO Financial Group, Inc.", "CNO", the "Company", "we", "us", and "our" as used in this report refer to CNO and its subsidiaries. Such terms, when used to describe insurance business and products, refer to the insurance business and products of CNO's insurance subsidiaries. We focus on serving middle-income pre-retiree and retired Americans, which we believe are attractive, underserved, high growth markets. We sell our products through exclusive agents, independent producers (some of whom sell one or more of our product lines exclusively) and direct marketing.
In its own words, from its 10-K, filed Feb 24, 2026.
CNO Financial Group against its Accident & Health Insurance peers
The largest companies of the same SEC industry, each at its latest quarter. Revenue growth: -9% against the peers' median -9%. Operating margin: 20.3% against the peers' median 15.3%.
| Company | Quarter | Revenue | Y/Y | Op. margin |
|---|---|---|---|---|
| CNO CNO Financial Group | Q3 2026 | $1.1B | -9% | 20.3% |
| PFG Principal Financial Group | Q3 2026 | $4.6B | +25% | 18.2% |
| AFL Aflac | Q3 2026 | $3.3B | -31% | 15.3% |
| UNM Unum | Q3 2026 | $2.5B | -25% | -21.6% |
| PRCH Porch Group | Q3 2026 | $144M | +13% | 12.6% |
Source: CNO Financial Group 10-Q on SEC EDGAR · CIK 1224608 · Accident & Health Insurance
Guidance and outlook
13F: who owns CNO and who is buying
More on CNO
History
Every quarter: Q3 2026 results · Q2 2026 results · Q1 2026 results · Q4 2025 results · Q3 2025 results · Q2 2025 results · Q1 2025 results