Filing Flows › Utilities › PPL (PPL)
PPL (PPL) earnings and revenue breakdown
Latest: Q3 2026 · 10-Q filed Nov 6, 2026 · PPL (PPL) Q3 2026 earnings results →
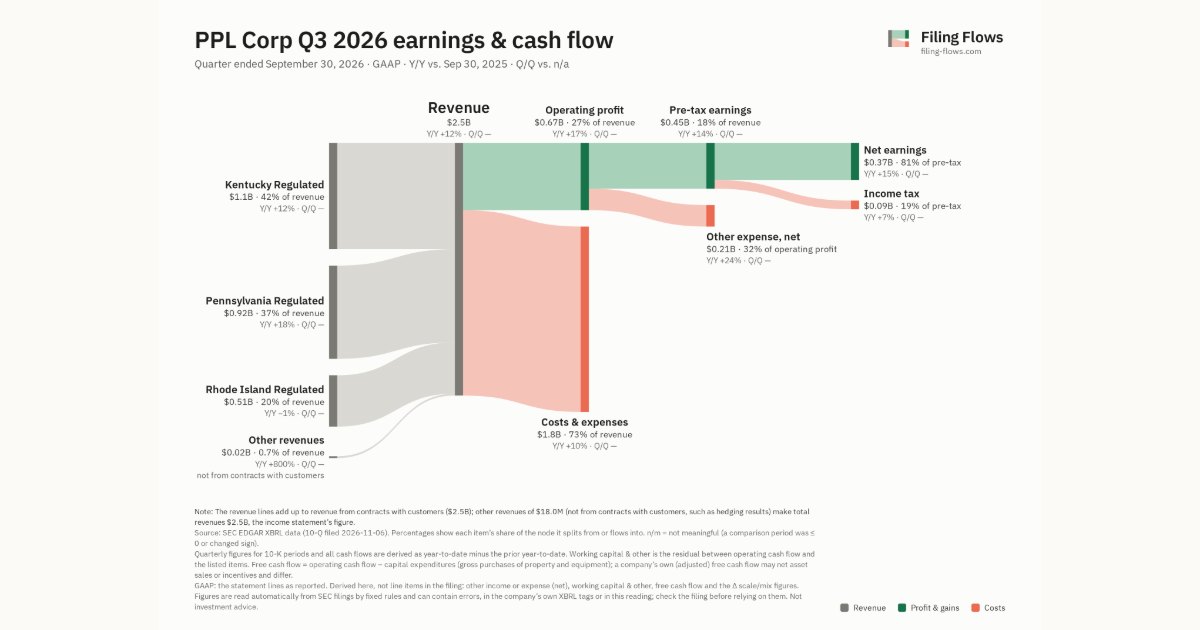
Q3 2026 Revenue up 12% year over year to $2.5B · 15¢ of every $1 of revenue kept as net profit · operating margin 26.6%
PPL made $2.5B in Q3 2026 (+12% Y/Y): Kentucky Regulated $1.1B, Pennsylvania Regulated $921M, Rhode Island Regulated $507M. Operating margin 26.6%, net earnings $367M. See where every dollar goes — costs, profit and cash — as a Sankey from the 10-Q filed Nov 6, 2026.
Drawing the Sankey…
Open the interactive Sankey → click any line for what the company wrote about it, compare Y/Y and Q/Q, export as PNG or PDF
What changed this quarter
Revenue was $2.5B in Q3 2026, up 12% year over year. Kentucky Regulated was the largest line at 42% of revenue. Pennsylvania Regulated added $0.14B year over year (up 18%), 54% of the total change. Rhode Island Regulated declined 1%.
Operating profit was $0.67B, a 26.6% margin (up 1.2 points year over year). Of the extra revenue versus Q3 2025, 37% reached operating profit, above the 25% margin then. Total costs grew 10% against revenue growth of 12%. Net earnings were $0.37B, up 15% year over year. The effective tax rate was 19.0%.
Operating cash flow was $0.92B (down 5% year over year), 250% of net earnings. Non-cash charges added back $0.37B of depreciation and $0.01B of share-based compensation. Working capital and other items added $0.17B. Capital expenditures of $1.2B exceeded it, leaving free cash flow of −$0.28B.
Quarterly history
| Quarter | Form | Filed | Revenue | Y/Y | Op. margin | Net earnings | Op. cash flow |
|---|---|---|---|---|---|---|---|
| Q3 2026 | 10-Q | Nov 6, 2026 | $2.5B | +12% | 26.6% | $367M | $916M |
| Q2 2026 | 10-Q | Aug 7, 2026 | $2.1B | +4% | 22.5% | $230M | $583M |
| Q1 2026 | 10-Q | May 8, 2026 | $2.8B | +11% | 26.9% | $452M | $557M |
| Q4 2025 | 10-K | Feb 20, 2026 | $2.3B | +3% | 20.9% | $266M | $548M |
| Q3 2025 | 10-Q | Nov 5, 2025 | $2.2B | +8% | 25.4% | $318M | $966M |
| Q2 2025 | 10-Q | Jul 31, 2025 | $2.0B | +8% | 20.0% | $183M | $602M |
| Q1 2025 | 10-Q | Apr 30, 2025 | $2.5B | +9% | 27.1% | $414M | $513M |
Charts
In supply chains and themes
Interactive views
The same charts as the app — open one to draw it.
💵Where each $1 goesinteractive
Loading the interactive chart…
🌏Named in Asian annual reportsinteractive
Loading the interactive chart…
🔄Rotation against the market and its industry (RRG)interactive
Loading the interactive chart…
🔍Earnings qualityinteractive
Loading the interactive chart…
⚖️Fair value by methodinteractive
Loading the interactive chart…
🔭Outlook & guidanceinteractive
Loading the interactive chart…
📈Investments: gains and what it boughtinteractive
Loading the interactive chart…
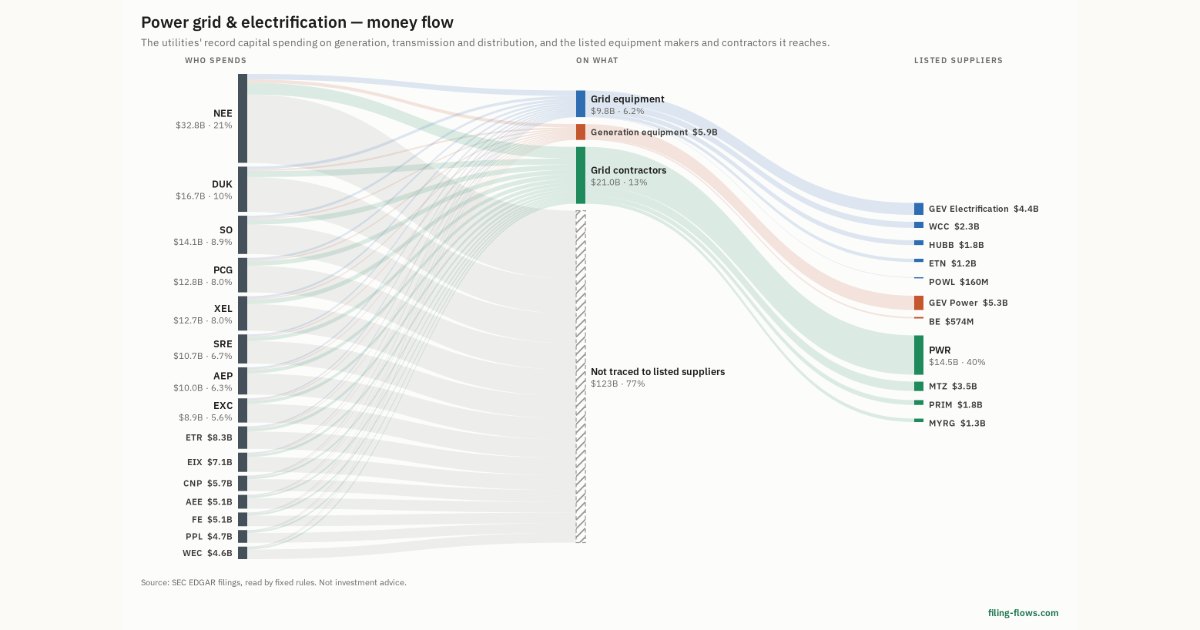
🏭Its industry’s money flow (input-output)interactive
Loading the interactive chart…
About PPL
PPL, headquartered in Allentown, Pennsylvania, is a utility holding company, incorporated in 1994. PPL, through its regulated utility subsidiaries, delivers electricity to customers in Pennsylvania, Kentucky, Virginia, and Rhode Island; delivers natural gas to customers in Kentucky and Rhode Island; and generates electricity from power plants in Kentucky. PPL Electric , headquartered in Allentown, Pennsylvania, is a wholly-owned subsidiary of PPL and a regulated public utility that is an electricity transmission and distribution service provider in eastern and central Pennsylvania. PPL Electric is subject to regulation as a public utility by the PAPUC, and certain of its transmission activities are subject to the jurisdiction of the FERC under the Federal Power Act.
In its own words, from its 10-K, filed Feb 20, 2026.
PPL against its Electric Services peers
The largest companies of the same SEC industry, each at its latest quarter. Revenue growth: +12% against the peers' median +13%. Operating margin: 26.6% against the peers' median 26.9%.
| Company | Quarter | Revenue | Y/Y | Op. margin |
|---|---|---|---|---|
| PPL PPL | Q3 2026 | $2.5B | +12% | 26.6% |
| Southern Power | Q3 2026 | $8.8B | +13% | 33.9% |
| NEE NextEra Energy | Q3 2026 | $8.1B | +2% | 32.4% |
| Florida Power & Light | Q2 2026 | $7.5B | +12% | 29.7% |
| CEG Constellation Energy | Q2 2026 | $7.5B | +23% | 7.7% |
| NRG NRG Energy | Q2 2026 | $7.5B | +11% | 13.0% |
| AEP Texas | Q3 2026 | $6.8B | +14% | 26.5% |
| VST Vistra | Q3 2026 | $6.3B | +28% | 26.9% |
| D Dominion Energy | Q3 2026 | $5.6B | +24% | 32.8% |
Source: PPL 10-Q on SEC EDGAR · CIK 922224 · Electric Services
13F: who owns PPL and who is buying
More on PPL
History
Every quarter: Q3 2026 results · Q2 2026 results · Q1 2026 results · Q4 2025 results · Q3 2025 results · Q2 2025 results · Q1 2025 results