Filing Flows › Industrials › RB Global (RBA)
RB Global (RBA) earnings and revenue breakdown
Latest: Q2 2026 · 10-Q filed Aug 4, 2026 · RB Global (RBA) Q2 2026 earnings results →
Q2 2026 Revenue up 11% year over year to $1.3B · 11¢ of every $1 of revenue kept as net profit · operating margin 17.1%
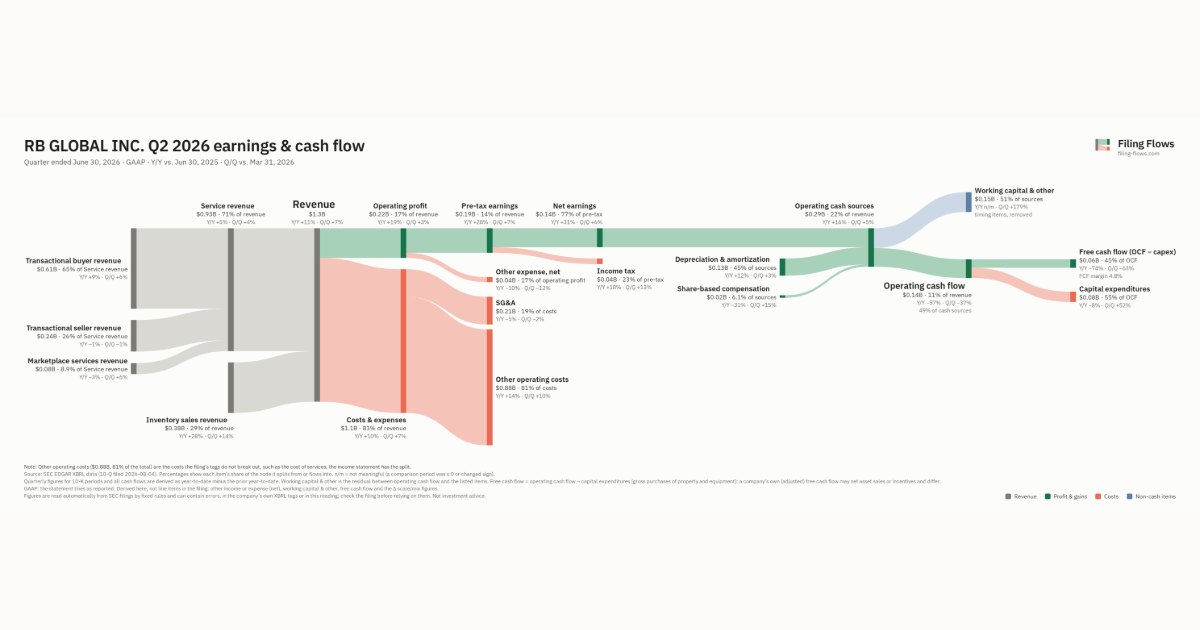
RB Global made $1.3B in Q2 2026 (+11% Y/Y): Service revenue $933M, Inventory sales revenue $384M. Operating margin 17.1%, net earnings $144M. See where every dollar goes — costs, profit and cash — as a Sankey from the 10-Q filed Aug 4, 2026.
Drawing the Sankey…
Open the interactive Sankey → click any line for what the company wrote about it, compare Y/Y and Q/Q, export as PNG or PDF
What changed this quarter
Revenue was $1.3B in Q2 2026, up 11% year over year and up 7% from the previous quarter. Transactional buyer revenue was the largest line at 46% of revenue. Inventory sales revenue added $0.08B year over year (up 28%), 65% of the total change. Marketplace services revenue declined 3%.
Operating profit was $0.22B, a 17.1% margin (up 1.2 points year over year). Of the extra revenue versus Q2 2025, 28% reached operating profit, above the 16% margin then. Total costs grew 10% against revenue growth of 11%. The fastest-growing cost line was Other operating costs (+14%). Net earnings were $0.14B, up 31% year over year. The effective tax rate was 22.8%.
Operating cash flow was $0.14B (down 57% year over year), 99% of net earnings. Non-cash charges added back $0.13B of depreciation and amortization and $0.02B of share-based compensation. Working capital and other items used $0.15B. Capital expenditures of $0.08B left free cash flow of $0.06B.
Quarterly history
| Quarter | Form | Filed | Revenue | Y/Y | Op. margin | Net earnings | Op. cash flow |
|---|---|---|---|---|---|---|---|
| Q2 2026 | 10-Q | Aug 4, 2026 | $1.3B | +11% | 17.1% | $144M | $142M |
| Q1 2026 | 10-Q | May 4, 2026 | $1.2B | +11% | 17.6% | $136M | $224M |
| Q4 2025 | 10-K | Feb 25, 2026 | $1.2B | +5% | 14.7% | $109M | $255M |
| Q3 2025 | 10-Q | Nov 6, 2025 | $1.1B | +11% | 14.5% | $95.2M | $240M |
| Q2 2025 | 10-Q | Aug 6, 2025 | $1.2B | +8% | 15.9% | $110M | $326M |
| Q1 2025 | 10-Q | May 7, 2025 | $1.1B | +4% | 17.1% | $113M | $157M |
| Q4 2024 | 10-K | Feb 26, 2025 | $1.1B | +10% | 18.1% | $118M | $184M |
Charts
Interactive views
The same charts as the app — open one to draw it.
💵Where each $1 goesinteractive
Loading the interactive chart…
🌏Named in Asian annual reportsinteractive
Loading the interactive chart…
🔄Rotation against the market and its industry (RRG)interactive
Loading the interactive chart…
🔍Earnings qualityinteractive
Loading the interactive chart…
⚖️Fair value by methodinteractive
Loading the interactive chart…
🔭Outlook & guidanceinteractive
Loading the interactive chart…
📈Investments: gains and what it boughtinteractive
Loading the interactive chart…
🏭Its industry’s money flow (input-output)interactive
Loading the interactive chart…
About RB Global
Established in 1958, the Company is a leading, omnichannel marketplace and trusted provider of value-added insights, services and transaction solutions for buyers and sellers of commercial assets and vehicles worldwide. Through our global network of auction sites and digital platform, we serve customers worldwide across a variety of asset classes, including automotive, construction, commercial transportation, government surplus, lifting and material handling, energy, mining and agriculture. Our marketplace brands include Ritchie Bros., the world's largest auctioneer of commercial assets and vehicles offering online bidding, and IAA, a leading global digital marketplace connecting vehicle buyers and sellers.
In its own words, from its 10-K, filed Feb 25, 2026.
RB Global against its Services-Business Services, NEC peers
The largest companies of the same SEC industry, each at its latest quarter. Revenue growth: +11% against the peers' median +11%. Operating margin: 17.1% against the peers' median 15.3%.
| Company | Quarter | Revenue | Y/Y | Op. margin |
|---|---|---|---|---|
| RBA RB Global | Q2 2026 | $1.3B | +11% | 17.1% |
| ACN Accenture | Q4 FY26 | $18.7B | +6% | 15.3% |
| UBER Uber Technologies | Q3 2026 | $14.8B | +10% | 9.8% |
| V Visa | Q4 FY26 | $12.1B | +13% | 59.8% |
| MELI MercadoLibre | Q3 2026 | $10.8B | +45% | 6.3% |
| MA Mastercard | Q3 2026 | $9.8B | +14% | 59.8% |
| PYPL PayPal Holdings | Q3 2026 | $8.6B | +2% | 16.3% |
| FISV Fiserv | Q3 2026 | $5.2B | -1% | -105.7% |
| DASH DoorDash | Q3 2026 | $4.6B | +34% | 9.6% |
Source: RB Global 10-Q on SEC EDGAR · CIK 1046102 · Services-Business Services, NEC
13F: who owns RBA and who is buying
More on RBA
History
Every quarter: Q2 2026 results · Q1 2026 results · Q4 2025 results · Q3 2025 results · Q2 2025 results · Q1 2025 results · Q4 2024 results