Filing Flows › Industrials › Reliance (RS)
Reliance (RS) earnings and revenue breakdown
Latest: Q3 2026 · 10-Q filed Oct 27, 2026 · Reliance (RS) Q3 2026 earnings results →
Q3 2026 Revenue up 43% year over year to $5.2B · 8¢ of every $1 of revenue kept as net profit · operating margin 10.6%
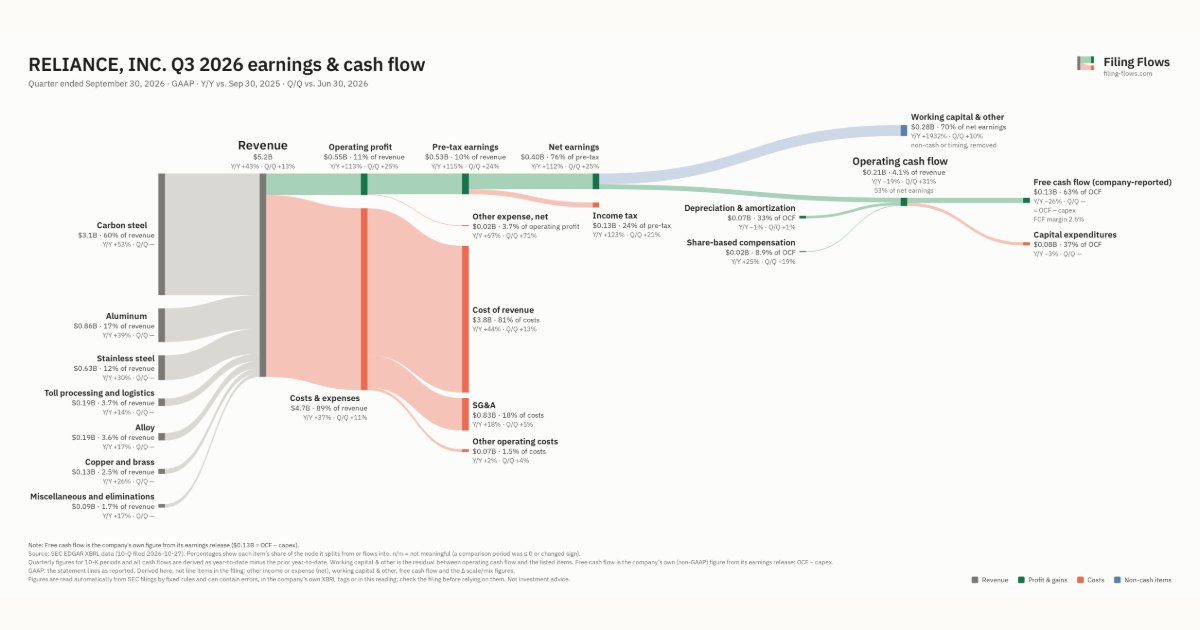
Reliance made $5.2B in Q3 2026 (+43% Y/Y): Carbon steel $3.1B, Aluminum $862M, Stainless steel $635M. Operating margin 10.6%, net earnings $403M. See where every dollar goes — costs, profit and cash — as a Sankey from the 10-Q filed Oct 27, 2026.
Drawing the Sankey…
Open the interactive Sankey → click any line for what the company wrote about it, compare Y/Y and Q/Q, export as PNG or PDF
What changed this quarter
Revenue was $5.2B in Q3 2026, up 43% year over year and up 13% from the previous quarter. Carbon steel was the largest line at 60% of revenue. Carbon steel added $1.1B year over year (up 53%), 70% of the total change.
Operating profit was $0.55B, a 10.6% margin (up 3.5 points year over year). Of the extra revenue versus Q3 2025, 19% reached operating profit, above the 7% margin then. Total costs grew 37% against revenue growth of 43%. The fastest-growing cost line was Cost of revenue (+44%). Net earnings were $0.40B, up 113% year over year. The effective tax rate was 24.2%.
Operating cash flow was $0.21B (down 19% year over year), 53% of net earnings. Non-cash charges added back $0.07B of depreciation and amortization and $0.02B of share-based compensation. Working capital and other items used $0.28B. After capital expenditures ($0.08B), free cash flow as the company reports it was $0.13B.
Quarterly history
| Quarter | Form | Filed | Revenue | Y/Y | Op. margin | Net earnings | Op. cash flow |
|---|---|---|---|---|---|---|---|
| Q3 2026 | 10-Q | Oct 27, 2026 | $5.2B | +43% | 10.6% | $403M | $212M |
| Q2 2026 | 10-Q | Jul 28, 2026 | $4.6B | +26% | 9.5% | $324M | $162M |
| Q1 2026 | 10-Q | Apr 29, 2026 | $4.0B | +16% | 9.1% | $266M | $151M |
| Q4 2025 | 10-K | Feb 26, 2026 | $3.5B | +12% | 4.8% | $117M | $276M |
| Q3 2025 | 10-Q | Oct 28, 2025 | $3.7B | +7% | 7.1% | $190M | $262M |
| Q2 2025 | 10-Q | Jul 30, 2025 | $3.7B | +0.5% | 8.5% | $234M | $229M |
| Q1 2025 | 10-Q | May 1, 2025 | $3.5B | -4% | 7.9% | $200M | $64.5M |
Charts
Interactive views
The same charts as the app — open one to draw it.
💵Where each $1 goesinteractive
Loading the interactive chart…
🌏Named in Asian annual reportsinteractive
Loading the interactive chart…
🔄Rotation against the market and its industry (RRG)interactive
Loading the interactive chart…
🔍Earnings qualityinteractive
Loading the interactive chart…
⚖️Fair value by methodinteractive
Loading the interactive chart…
🔭Outlook & guidanceinteractive
Loading the interactive chart…
📈Investments: gains and what it boughtinteractive
Loading the interactive chart…
🏭Its industry’s money flow (input-output)interactive
Loading the interactive chart…
About Reliance
Reliance operates a network of companies providing diversified metal solutions and is the largest metals service center company in North America (U.S. and Canada) based on revenues, with 2024 net sales of $13.84 billion. This is our 85th anniversary as a business since our original organization on February 3, 1939, operating a single metals service center in Los Angeles, California fabricating steel reinforcing bar. In February 2024, we changed our corporate name to Reliance, Inc. from Reliance Steel & Aluminum Co. Our common stock has traded on the New York Stock Exchange (“NYSE”) for 30 years under the symbol “RS” since our September 16, 1994 initial public offering.
In its own words, from its 10-K, filed Feb 27, 2025.
Reliance against its Wholesale-Metals Service Centers & of fices peers
The largest companies of the same SEC industry, each at its latest quarter. Revenue growth: +43% against the peers' median +46%. Operating margin: 10.6% against the peers' median 6.0%.
| Company | Quarter | Revenue | Y/Y | Op. margin |
|---|---|---|---|---|
| RS Reliance | Q3 2026 | $5.2B | +43% | 10.6% |
| RYZ Ryerson Holding | Q3 2026 | $2.2B | +88% | 2.4% |
| FSTR Foster L B | Q3 2026 | $168M | +22% | 6.0% |
| GWAV Greenwave Technology Solutions | Q2 2026 | $16.0M | +46% | -17.8% |
Source: Reliance 10-Q on SEC EDGAR · CIK 861884 · Wholesale-Metals Service Centers & of fices
Guidance and outlook
13F: who owns RS and who is buying
More on RS
History
Every quarter: Q3 2026 results · Q2 2026 results · Q1 2026 results · Q4 2025 results · Q3 2025 results · Q2 2025 results · Q1 2025 results
- Reliance guidance history: guided vs reported
- Reliance operating margin by quarter
- Reliance net income by quarter
- Reliance free cash flow by quarter
- Reliance capital expenditures by quarter
- Reliance Carbon steel revenue by quarter
- Reliance Aluminum revenue by quarter
- Reliance Stainless steel revenue by quarter