Filing Flows › Consumer Discretionary › Somnigroup International (SGI)
Somnigroup International (SGI) earnings and revenue breakdown
Latest: Q2 2026 · 10-Q filed Aug 7, 2026 · Somnigroup International (SGI) Q2 2026 earnings results →
Q2 2026 Revenue down 3% year over year to $1.8B · 6¢ of every $1 of revenue kept as net profit · operating margin 11.1%
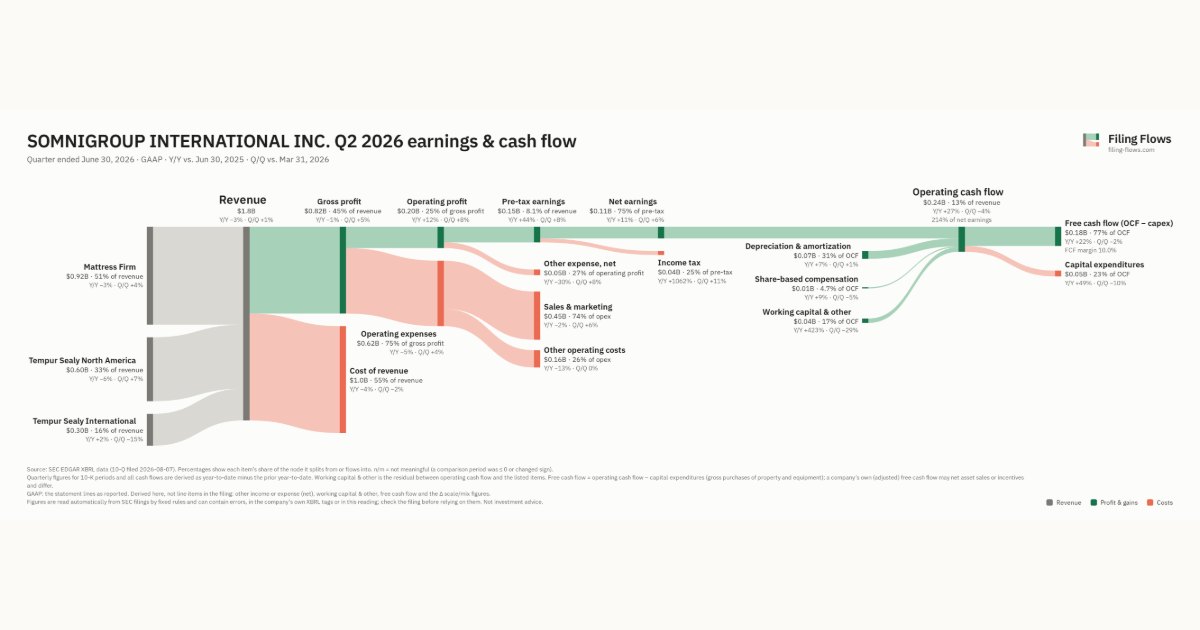
Somnigroup International made $1.8B in Q2 2026 (-3% Y/Y): Mattress Firm $922M, Tempur Sealy North America $602M, Tempur Sealy International $300M. Operating margin 11.1%, net earnings $111M. See where every dollar goes — costs, profit and cash — as a Sankey from the 10-Q filed Aug 7, 2026.
Drawing the Sankey…
Open the interactive Sankey → click any line for what the company wrote about it, compare Y/Y and Q/Q, export as PNG or PDF
What changed this quarter
Revenue was $1.8B in Q2 2026, down 3% year over year and up 1% from the previous quarter. Mattress Firm was the largest line at 51% of revenue. Tempur Sealy North America lost $0.04B year over year (down 6%), 64% of the total change.
Gross margin was 44.8%, up 0.8 points from Q2 2025. Operating profit was $0.20B, a 11.1% margin (up 1.5 points year over year). Operating expenses fell 5% while revenue fell 3%. Net earnings were $0.11B, up 12% year over year. The effective tax rate was 25.2%.
Operating cash flow was $0.24B (up 27% year over year), 214% of net earnings. Non-cash charges added back $0.07B of depreciation and amortization and $0.01B of share-based compensation. Working capital and other items added $0.04B. Capital expenditures of $0.05B left free cash flow of $0.18B.
Quarterly history
| Quarter | Form | Filed | Revenue | Y/Y | Op. margin | Net earnings | Op. cash flow |
|---|---|---|---|---|---|---|---|
| Q2 2026 | 10-Q | Aug 7, 2026 | $1.8B | -3% | 11.1% | $111M | $236M |
| Q1 2026 | 10-Q | May 8, 2026 | $1.8B | +12% | 10.4% | $104M | $246M |
| Q4 2025 | 10-K | Feb 27, 2026 | $1.9B | +55% | 13.2% | $141M | $99.4M |
| Q3 2025 | 10-Q | Nov 7, 2025 | $2.1B | +63% | 14.8% | $178M | $408M |
| Q2 2025 | 10-Q | Aug 8, 2025 | $1.9B | +52% | 9.6% | $99.5M | $186M |
| Q1 2025 | 10-Q | May 12, 2025 | $1.6B | +35% | 0.8% | −$32.8M | $106M |
| Q4 2024 | 10-K | Feb 28, 2025 | $1.2B | +3% | 10.6% | $72.6M | $129M |
Charts
Interactive views
The same charts as the app — open one to draw it.
💵Where each $1 goesinteractive
Loading the interactive chart…
🌏Named in Asian annual reportsinteractive
Loading the interactive chart…
🔄Rotation against the market and its industry (RRG)interactive
Loading the interactive chart…
🔍Earnings qualityinteractive
Loading the interactive chart…
⚖️Fair value by methodinteractive
Loading the interactive chart…
🔭Outlook & guidanceinteractive
Loading the interactive chart…
📈Investments: gains and what it boughtinteractive
Loading the interactive chart…
🏭Its industry’s money flow (input-output)interactive
Loading the interactive chart…
About Somnigroup International
Somnigroup is the world's largest bedding company, dedicated to enriching people's lives through the power of a good night's sleep and transforming how the world sleeps. With superior capabilities in design, manufacturing, distribution and retail, we deliver breakthrough sleep solutions and serve the evolving needs of consumers in over 100 countries worldwide through our fully-owned businesses, Tempur Sealy, Mattress Firm and Dreams. Our portfolio includes the most highly recognized brands in the industry, including Tempur-Pedic®, Sealy® and Stearns & Foster®, and our global omni-channel platform enables us to meet consumers wherever they shop, offering a personal connection and innovation to provide a unique retail experience and tailored solutions.
In its own words, from its 10-K, filed Feb 27, 2026.
Somnigroup International against its Household Furniture peers
The largest companies of the same SEC industry, each at its latest quarter. Revenue growth: -3% against the peers' median -3%. Operating margin: 11.1% against the peers' median 5.9%.
| Company | Quarter | Revenue | Y/Y | Op. margin |
|---|---|---|---|---|
| SGI Somnigroup International | Q2 2026 | $1.8B | -3% | 11.1% |
| Leggett & Platt | Q2 2026 | $1.0B | -6% | 6.8% |
| LZB La-Z-Boy | Q1 FY27 | $476M | -3% | -0.4% |
| CODI Compass Diversified | Q3 2026 | $423M | -10% | 7.5% |
| FLXS Flexsteel Industries | Q1 FY27 | $114M | +3% | 6.0% |
| PRPL Purple Innovation | Q3 2026 | $96.5M | -19% | -10.1% |
| HOFT Hooker Furnishings | Q2 FY27 | $63.2M | -9% | 2.0% |
| LUVU Luvu Brands | Q4 FY26 | $8.1M | +14% | 5.9% |
| XMAX XMax | Q2 2026 | $2.7M | +7% | -44.5% |
Source: Somnigroup International 10-Q on SEC EDGAR · CIK 1206264 · Household Furniture
13F: who owns SGI and who is buying
More on SGI
- How Somnigroup International makes money: revenue by segment
- Somnigroup International next earnings date and what analysts expect
- Somnigroup International stock forecast, price target and fair value
- Who owns Somnigroup International stock: holders, funds and Congress trades
- Is Somnigroup International a takeover target? LBO and rumors
History
Every quarter: Q2 2026 results · Q1 2026 results · Q4 2025 results · Q3 2025 results · Q2 2025 results · Q1 2025 results · Q4 2024 results
- Somnigroup International guidance history: guided vs reported
- Somnigroup International gross margin by quarter
- Somnigroup International operating margin by quarter
- Somnigroup International net income by quarter
- Somnigroup International free cash flow by quarter
- Somnigroup International capital expenditures by quarter
- Somnigroup International Mattress Firm revenue by quarter
- Somnigroup International Tempur Sealy North America revenue by quarter
- Somnigroup International Tempur Sealy International revenue by quarter