Filing Flows › Industrials › Veralto (VLTO)
Veralto (VLTO) earnings and revenue breakdown
Latest: Q3 2026 · 10-Q filed Oct 30, 2026 · Veralto (VLTO) Q3 2026 earnings results →
Q3 2026 Revenue up 8% year over year to $1.5B · 17¢ of every $1 of revenue kept as net profit · operating margin 19.7%
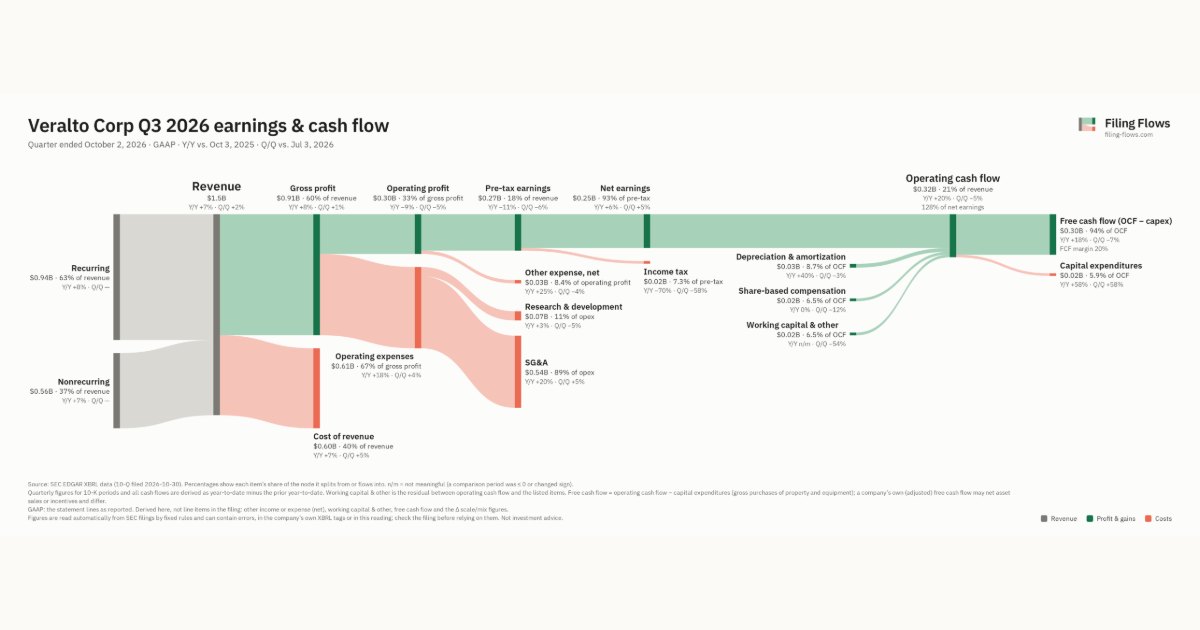
Veralto made $1.5B in Q3 2026 (+8% Y/Y): Recurring $944M, Nonrecurring $565M. Operating margin 19.7%, net earnings $253M. See where every dollar goes — costs, profit and cash — as a Sankey from the 10-Q filed Oct 30, 2026.
Drawing the Sankey…
Open the interactive Sankey → click any line for what the company wrote about it, compare Y/Y and Q/Q, export as PNG or PDF
What changed this quarter
Revenue was $1.5B in Q3 2026, up 7% year over year and up 2% from the previous quarter. Recurring was the largest line at 63% of revenue. Recurring added $0.07B year over year (up 8%), 65% of the total change.
Gross margin was 60.2%, up 0.1 points from Q3 2025. Operating profit was $0.30B, a 19.7% margin (down 3.5 points year over year). Operating profit fell $0.03B even though revenue rose $0.10B versus Q3 2025, so costs grew faster than sales. Operating expenses grew 18% against revenue growth of 7%. The fastest-growing cost line was SG&A (+20%). Net earnings were $0.25B, up 6% year over year. The effective tax rate was 7.3%.
Operating cash flow was $0.32B (up 20% year over year), 128% of net earnings. Non-cash charges added back $0.03B of depreciation and amortization and $0.02B of share-based compensation. Working capital and other items added $0.02B. Capital expenditures of $0.02B left free cash flow of $0.30B.
Quarterly history
| Quarter | Form | Filed | Revenue | Y/Y | Op. margin | Net earnings | Op. cash flow |
|---|---|---|---|---|---|---|---|
| Q3 2026 | 10-Q | Oct 30, 2026 | $1.5B | +8% | 19.7% | $253M | $323M |
| Q2 2026 | 10-Q | Jul 29, 2026 | $1.5B | +8% | 21.4% | $241M | $340M |
| Q1 2026 | 10-Q | Apr 29, 2026 | $1.4B | +7% | 23.8% | $254M | $182M |
| Q4 2025 | 10-K | Feb 20, 2026 | $1.4B | +4% | 22.6% | $254M | $311M |
| Q3 2025 | 10-Q | Oct 29, 2025 | $1.4B | +7% | 23.2% | $239M | $270M |
| Q2 2025 | 10-Q | Jul 28, 2025 | $1.4B | +6% | 22.8% | $222M | $339M |
| Q1 2025 | 10-Q | Apr 30, 2025 | $1.3B | +7% | 24.2% | $225M | $157M |
Charts
Interactive views
The same charts as the app — open one to draw it.
💵Where each $1 goesinteractive
Loading the interactive chart…
🌏Named in Asian annual reportsinteractive
Loading the interactive chart…
🔄Rotation against the market and its industry (RRG)interactive
Loading the interactive chart…
🔍Earnings qualityinteractive
Loading the interactive chart…
⚖️Fair value by methodinteractive
Loading the interactive chart…
🔭Outlook & guidanceinteractive
Loading the interactive chart…
📈Investments: gains and what it boughtinteractive
Loading the interactive chart…
🏭Its industry’s money flow (input-output)interactive
Loading the interactive chart…
About Veralto
Veralto Corporation’s unifying purpose is Safeguarding the World’s Most Vital Resources TM . Our diverse group of leading operating companies provide essential technology solutions that monitor, enhance and protect key resources around the globe. We are committed to the advancement of public health and safety and believe we are positioned to support our customers as they address large global challenges including environmental resource sustainability, water scarcity, management of severe weather events, food and pharmaceutical security, and the impact of an aging workforce. For decades, we have used our scientific expertise and innovative technologies to address complex challenges our customers face across regulated industries – including municipal utilities, food and beverage, pharmaceutical and industrials – where the consequence of failure is high.
In its own words, from its 10-K, filed Feb 20, 2026.
Veralto against its Instruments For Meas & Testing of Electricity & Elec Signals peers
The largest companies of the same SEC industry, each at its latest quarter. Revenue growth: +8% against the peers' median +34%. Operating margin: 19.7% against the peers' median 15.9%.
| Company | Quarter | Revenue | Y/Y | Op. margin |
|---|---|---|---|---|
| VLTO Veralto | Q3 2026 | $1.5B | +8% | 19.7% |
| TER Teradyne | Q3 2026 | $1.3B | +70% | 30.8% |
| ITRI Itron | Q3 2026 | $599M | +3% | 15.9% |
| COHU Cohu | Q3 2026 | $173M | +37% | 7.4% |
| ALNT Allient | Q3 2026 | $164M | +18% | 13.6% |
| TRNS Transcat | Q2 FY27 | $97.1M | +18% | 5.2% |
| INTT Intest | Q3 2026 | $35.1M | +34% | 7.8% |
| AEHR Aehr Test Systems | Q3 2026 | $33.0M | — | 18.3% |
| FEIM Frequency Electronics | Q1 FY27 | $23.5M | +70% | 22.2% |
Source: Veralto 10-Q on SEC EDGAR · CIK 1967680 · Instruments For Meas & Testing of Electricity & Elec Signals
Guidance and outlook
13F: who owns VLTO and who is buying
More on VLTO
History
Every quarter: Q3 2026 results · Q2 2026 results · Q1 2026 results · Q4 2025 results · Q3 2025 results · Q2 2025 results · Q1 2025 results
- Veralto guidance history: guided vs reported
- Veralto gross margin by quarter
- Veralto operating margin by quarter
- Veralto net income by quarter
- Veralto free cash flow by quarter
- Veralto R&D spending by quarter
- Veralto capital expenditures by quarter
- Veralto Recurring revenue by quarter
- Veralto Nonrecurring revenue by quarter