Filing Flows › Technology › Arista Networks (ANET)
Arista Networks (ANET) earnings and revenue breakdown
Latest: Q3 2026 · 10-Q filed Nov 4, 2026 · Arista Networks (ANET) Q3 2026 earnings results →
Q3 2026 Revenue up 58% year over year to $3.7B · 43¢ of every $1 of revenue kept as net profit · operating margin 44.9%
Arista Networks made $3.7B in Q3 2026 (+58% Y/Y): Product $3.2B, Service $468M. Operating margin 44.9%, net earnings $1.6B. See where every dollar goes — costs, profit and cash — as a Sankey from the 10-Q filed Nov 4, 2026.
Drawing the Sankey…
Open the interactive Sankey → click any line for what the company wrote about it, compare Y/Y and Q/Q, export as PNG or PDF
What changed this quarter
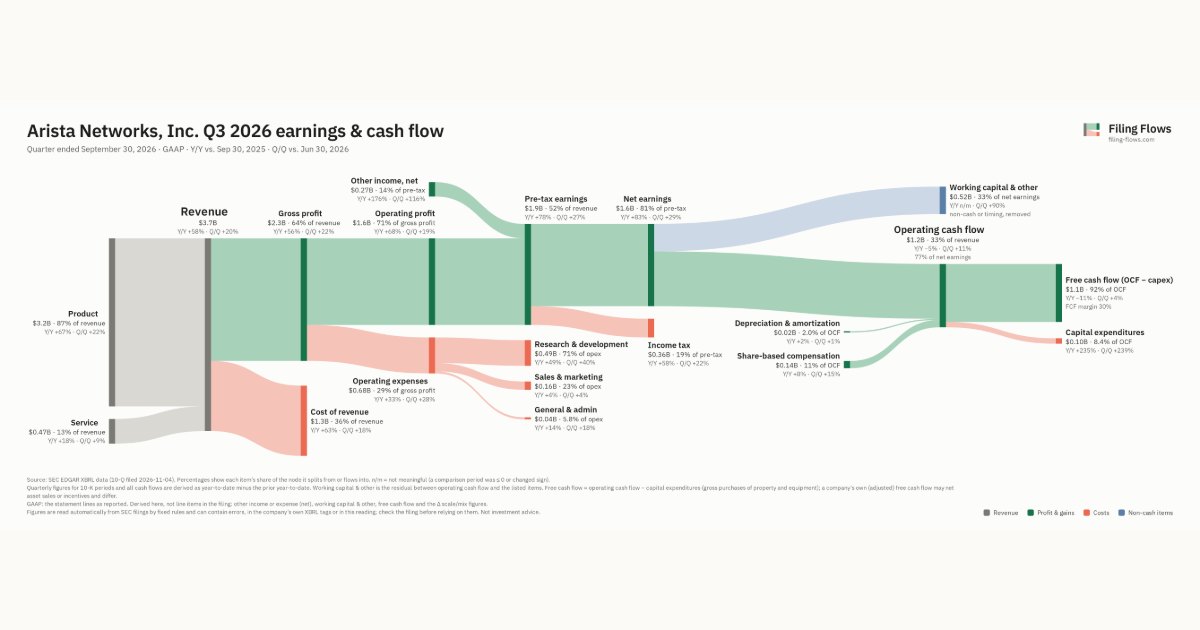
Revenue was $3.7B in Q3 2026, up 58% year over year and up 20% from the previous quarter. Product was the largest line at 87% of revenue. Product added $1.3B year over year (up 67%), 95% of the total change.
Gross margin was 63.6%, down 1.0 points from Q3 2025. Operating profit was $1.6B, a 44.9% margin (up 2.5 points year over year). Of the extra revenue versus Q3 2025, 49% reached operating profit, above the 42% margin then. Operating expenses grew 33% against revenue growth of 58%. The fastest-growing cost line was Research & development (+49%). Net earnings were $1.6B, up 83% year over year. The effective tax rate was 18.5%.
Operating cash flow was $1.2B (down 5% year over year), 77% of net earnings. Non-cash charges added back $0.02B of depreciation and amortization and $0.14B of share-based compensation. Working capital and other items used $0.52B. Capital expenditures of $0.10B left free cash flow of $1.1B.
Quarterly history
| Quarter | Form | Filed | Revenue | Y/Y | Op. margin | Net earnings | Op. cash flow |
|---|---|---|---|---|---|---|---|
| Q3 2026 | 10-Q | Nov 4, 2026 | $3.7B | +58% | 44.9% | $1.6B | $1.2B |
| Q2 2026 | 10-Q | Aug 5, 2026 | $3.0B | +38% | 45.4% | $1.2B | $1.1B |
| Q1 2026 | 10-Q | May 6, 2026 | $2.7B | +35% | 42.7% | $1.0B | $1.7B |
| Q4 2025 | 10-K | Feb 17, 2026 | $2.5B | +29% | 41.5% | $956M | $1.3B |
| Q3 2025 | 10-Q | Nov 5, 2025 | $2.3B | +28% | 42.4% | $853M | $1.3B |
| Q2 2025 | 10-Q | Aug 6, 2025 | $2.2B | +30% | 44.7% | $889M | $1.2B |
| Q1 2025 | 10-Q | May 7, 2025 | $2.0B | +28% | 42.8% | $814M | $642M |
Charts
In supply chains and themes
Interactive views
The same charts as the app — open one to draw it.
💵Where each $1 goesinteractive
Loading the interactive chart…
🌏Named in Asian annual reportsinteractive
Loading the interactive chart…
🔄Rotation against the market and its industry (RRG)interactive
Loading the interactive chart…
🔍Earnings qualityinteractive
Loading the interactive chart…
⚖️Fair value by methodinteractive
Loading the interactive chart…
🔭Outlook & guidanceinteractive
Loading the interactive chart…
📈Investments: gains and what it boughtinteractive
Loading the interactive chart…
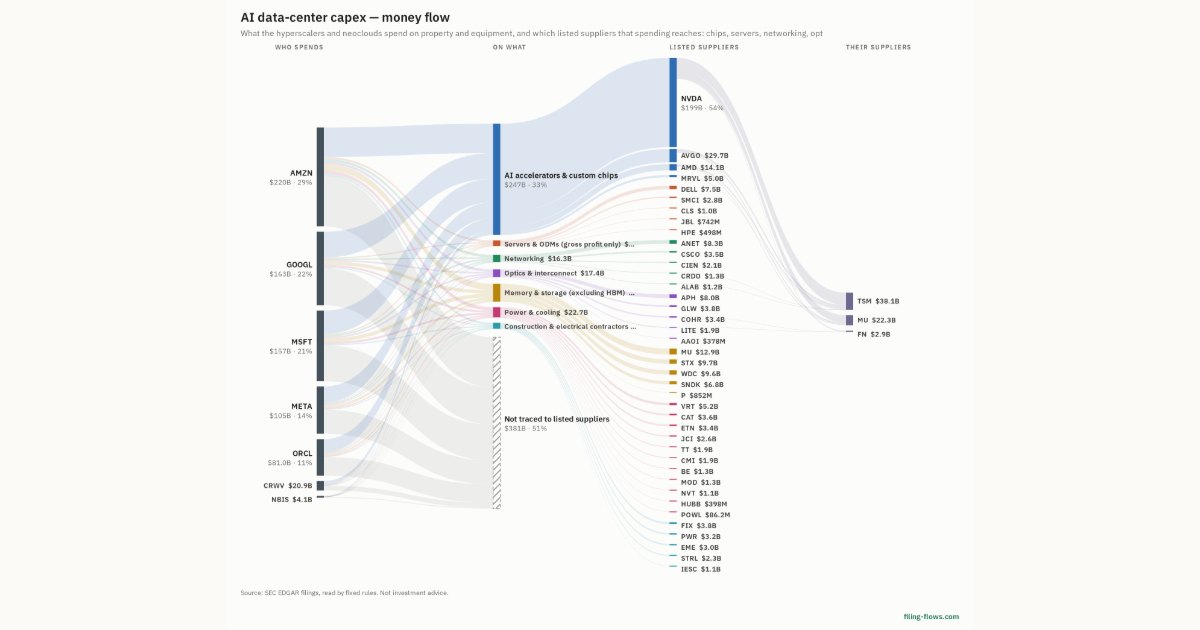
🏭Its industry’s money flow (input-output)interactive
Loading the interactive chart…
Customers and suppliers named in filings
Sells to
Buys from
About Arista Networks
In a world where data is increasingly a precious commodity and competitive differentiator, Arista was founded to enable our customers to access all their centers of data in the quickest, most reliable, and secure manner. Over the last two decades, we have emerged as an industry leader, delivering data-driven, client-to-cloud networking-as-a-service. Our “Centers of Data” strategy is a fundamental pivot from legacy networking approaches that create incongruent silos to a unified, data-driven approach in which the network is a service that interconnects four primary domains: AI Centers, Data Centers, Campus Centers, and WAN Centers. Anchored by Arista’s state-oriented Extensible Operating System (EOS) and Network Data Lake (NetDL), our network-as-a-service platform delivers a seamless, consolidated networking experience regardless of data location.
In its own words, from its 10-K, filed Feb 17, 2026.
Arista Networks against its Computer Communications Equipment peers
The largest companies of the same SEC industry, each at its latest quarter. Revenue growth: +58% against the peers' median +11%. Operating margin: 44.9% against the peers' median 16.5%.
| Company | Quarter | Revenue | Y/Y | Op. margin |
|---|---|---|---|---|
| ANET Arista Networks | Q3 2026 | $3.7B | +58% | 44.9% |
| CSCO Cisco Systems | Q4 FY26 | $17.3B | +18% | 24.7% |
| FFIV F5 | Q3 FY26 | $865M | +11% | 24.7% |
| EXTR Extreme Networks | Q1 FY27 | $341M | +10% | 6.8% |
| NTGR Netgear | Q3 2026 | $167M | -9% | -8.2% |
| DGII Digi International | Q3 FY26 | $139M | +29% | 16.5% |
| ATEN A10 Networks | Q3 2026 | $91.5M | +23% | 20.0% |
| LTRX Lantronix | Q4 FY26 | $31.2M | +8% | -1.3% |
| FOXX Foxx Development Holdings | Q4 FY26 | $7.0M | -50% | -97.7% |
Source: Arista Networks 10-Q on SEC EDGAR · CIK 1596532 · Computer Communications Equipment
Guidance and outlook
13F: who owns ANET and who is buying
More on ANET
- How Arista Networks makes money: revenue by segment
- Arista Networks next earnings date and what analysts expect
- Arista Networks stock forecast, price target and fair value
- Who owns Arista Networks stock: holders, funds and Congress trades
- Arista Networks guidance and outlook
- Is Arista Networks a takeover target? LBO and rumors
- Arista Networks recalls, complaints and regulation
History
Every quarter: Q3 2026 results · Q2 2026 results · Q1 2026 results · Q4 2025 results · Q3 2025 results · Q2 2025 results · Q1 2025 results
- Arista Networks guidance history: guided vs reported
- Arista Networks gross margin by quarter
- Arista Networks operating margin by quarter
- Arista Networks net income by quarter
- Arista Networks free cash flow by quarter
- Arista Networks R&D spending by quarter
- Arista Networks capital expenditures by quarter
- Arista Networks Product revenue by quarter
- Arista Networks Service revenue by quarter