Filing Flows › Technology › Cadence Design Systems (CDNS)
Cadence Design Systems (CDNS) earnings and revenue breakdown
Latest: Q3 2026 · 10-Q filed Oct 28, 2026 · Cadence Design Systems (CDNS) Q3 2026 earnings results →
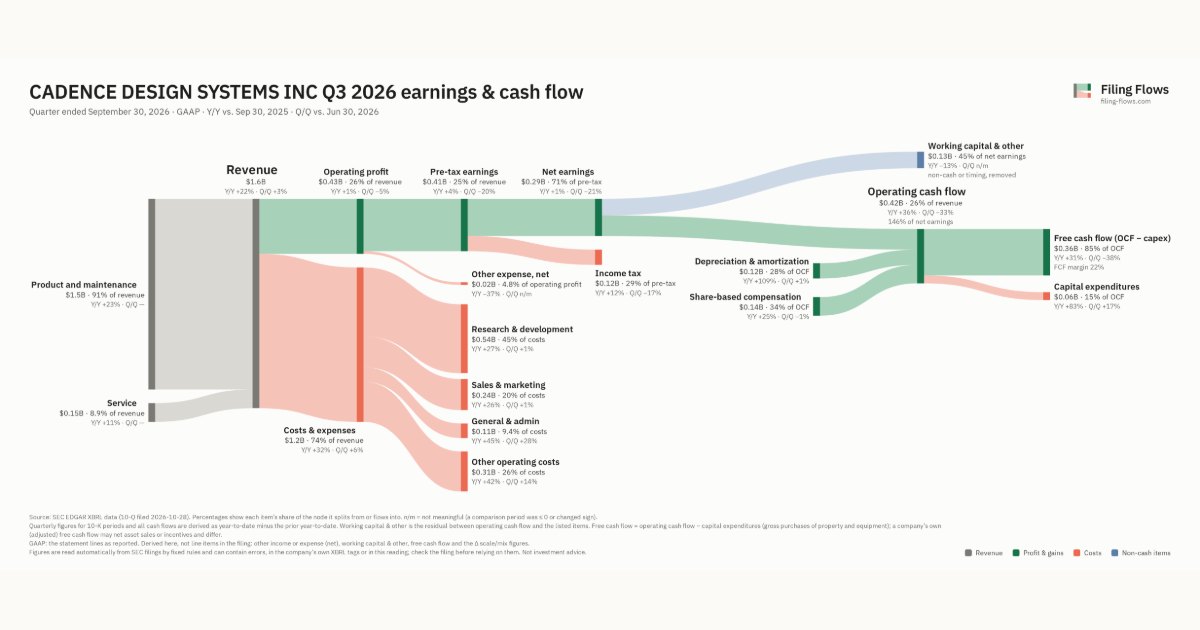
Q3 2026 Revenue up 22% year over year to $1.6B · 18¢ of every $1 of revenue kept as net profit · operating margin 26.2%
Cadence Design Systems made $1.6B in Q3 2026 (+22% Y/Y): Product and maintenance $1.5B, Service $146M. Operating margin 26.2%, net earnings $290M. See where every dollar goes — costs, profit and cash — as a Sankey from the 10-Q filed Oct 28, 2026.
Drawing the Sankey…
Open the interactive Sankey → click any line for what the company wrote about it, compare Y/Y and Q/Q, export as PNG or PDF
What changed this quarter
Revenue was $1.6B in Q3 2026, up 22% year over year and up 3% from the previous quarter. Product and maintenance was the largest line at 91% of revenue. Product and maintenance added $0.28B year over year (up 23%), 95% of the total change.
Operating profit was $0.43B, a 26.2% margin (down 5.5 points year over year). Of the extra revenue versus Q3 2025, 1% reached operating profit, below the 32% margin then. Total costs grew 32% against revenue growth of 22%. The fastest-growing cost line was General & admin (+45%). Net earnings were $0.29B, up 1% year over year. The effective tax rate was 29.0%.
Operating cash flow was $0.42B (up 36% year over year), 146% of net earnings. Non-cash charges added back $0.12B of depreciation and amortization and $0.14B of share-based compensation. Working capital and other items used $0.13B. Capital expenditures of $0.06B left free cash flow of $0.36B.
Quarterly history
| Quarter | Form | Filed | Revenue | Y/Y | Op. margin | Net earnings | Op. cash flow |
|---|---|---|---|---|---|---|---|
| Q3 2026 | 10-Q | Oct 28, 2026 | $1.6B | +22% | 26.2% | $290M | $424M |
| Q2 2026 | 10-Q | Jul 29, 2026 | $1.6B | +24% | 28.4% | $367M | $635M |
| Q1 2026 | 10-Q | May 1, 2026 | $1.5B | +19% | 29.3% | $336M | $356M |
| Q4 2025 | 10-K | Feb 19, 2026 | $1.4B | +6% | 32.2% | $388M | $553M |
| Q3 2025 | 10-Q | Oct 29, 2025 | $1.3B | +10% | 31.8% | $287M | $311M |
| Q2 2025 | 10-Q | Jul 30, 2025 | $1.3B | +20% | 19.0% | $160M | $378M |
| Q1 2025 | 10-Q | Apr 30, 2025 | $1.2B | +23% | 29.1% | $274M | $487M |
Charts
Interactive views
The same charts as the app — open one to draw it.
💵Where each $1 goesinteractive
Loading the interactive chart…
🌏Named in Asian annual reportsinteractive
Loading the interactive chart…
🔄Rotation against the market and its industry (RRG)interactive
Loading the interactive chart…
🔍Earnings qualityinteractive
Loading the interactive chart…
⚖️Fair value by methodinteractive
Loading the interactive chart…
🔭Outlook & guidanceinteractive
Loading the interactive chart…
📈Investments: gains and what it boughtinteractive
Loading the interactive chart…
🏭Its industry’s money flow (input-output)interactive
Loading the interactive chart…
Customers and suppliers named in filings
Buys from
About Cadence Design Systems
This Annual Report and the documents incorporated by reference in this Annual Report contain statements that are not historical in nature, are predictive, or that depend upon or refer to future events or conditions or contain other forward-looking statements. Statements including, but not limited to, statements regarding artificial intelligence (“AI"), other technological and market advancements and their impacts on our business; the extent, timing and mix of future revenues and customer demand; the deployment of our products and services; the impact of the macroeconomic and geopolitical environment, including but not limited to, expanded trade controls, tariffs, conflicts around the world, volatility in foreign currency exchange rates, inflation and changes in interest rates; the impact of government actions; future costs, expenses, tax rates and uses of cash; pending legal,…
In its own words, from its 10-K, filed Feb 19, 2026.
Cadence Design Systems against its Services-Prepackaged Software peers
The largest companies of the same SEC industry, each at its latest quarter. Revenue growth: +22% against the peers' median +19%. Operating margin: 26.2% against the peers' median 20.5%.
| Company | Quarter | Revenue | Y/Y | Op. margin |
|---|---|---|---|---|
| CDNS Cadence Design Systems | Q3 2026 | $1.6B | +22% | 26.2% |
| MSFT Microsoft | Q1 FY27 | $92.3B | +19% | 49.8% |
| ORCL Oracle | Q1 FY27 | $19.3B | +30% | 34.8% |
| CRM Salesforce | Q2 FY27 | $11.3B | +11% | 20.5% |
| ADBE Adobe | Q3 FY26 | $6.8B | +13% | 34.8% |
| XYZ Block | Q3 2026 | $6.7B | +10% | 6.4% |
| INTU Intuit | Q4 FY26 | $4.4B | +14% | 10.9% |
| NOW ServiceNow | Q3 2026 | $4.1B | +20% | 9.4% |
| SHOP Shopify | Q3 2026 | $3.7B | +32% | 15.2% |
Source: Cadence Design Systems 10-Q on SEC EDGAR · CIK 813672 · Services-Prepackaged Software
Guidance and outlook
13F: who owns CDNS and who is buying
More on CDNS
History
Every quarter: Q3 2026 results · Q2 2026 results · Q1 2026 results · Q4 2025 results · Q3 2025 results · Q2 2025 results · Q1 2025 results
- Cadence Design Systems guidance history: guided vs reported
- Cadence Design Systems operating margin by quarter
- Cadence Design Systems net income by quarter
- Cadence Design Systems free cash flow by quarter
- Cadence Design Systems R&D spending by quarter
- Cadence Design Systems capital expenditures by quarter
- Cadence Design Systems Product and maintenance revenue by quarter
- Cadence Design Systems Service revenue by quarter