Filing Flows › Utilities › CMS Energy (CMS)
CMS Energy (CMS) earnings and revenue breakdown
Latest: Q3 2026 · 10-Q filed Oct 27, 2026 · CMS Energy (CMS) Q3 2026 earnings results →
Q3 2026 Revenue up 8% year over year to $2.2B · 4¢ of every $1 of revenue lost · operating margin 2.2%
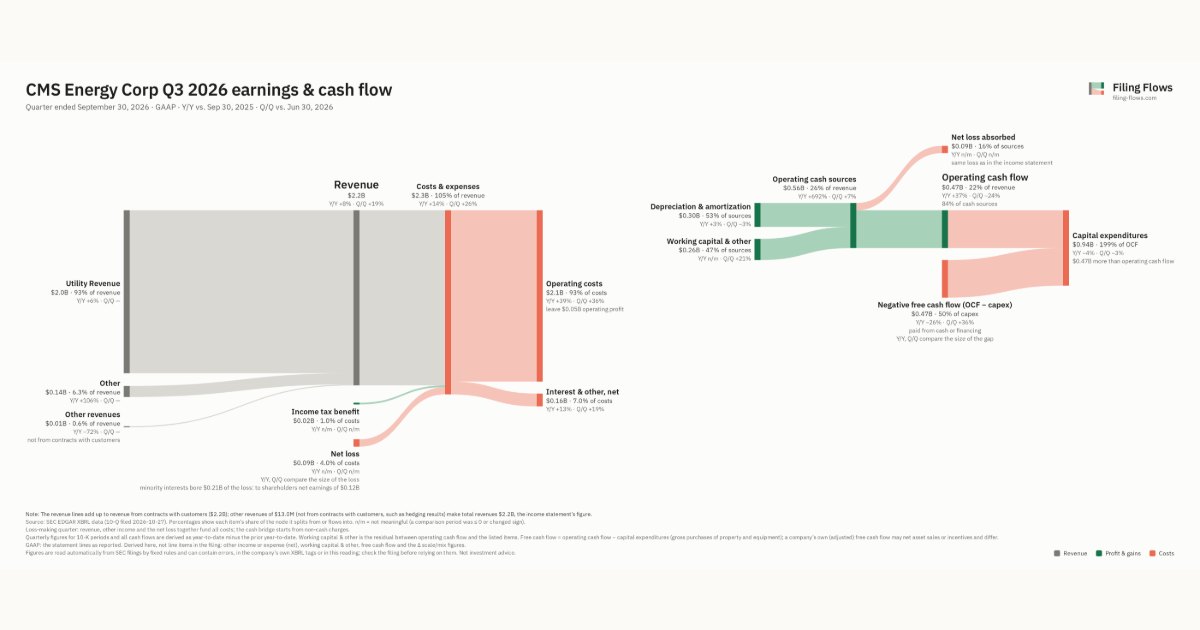
CMS Energy made $2.2B in Q3 2026 (+8% Y/Y): Utility Revenue $2.0B, Other $138M, Other revenues $13.0M. Operating margin 2.2%, net loss $91.0M. See where every dollar goes — costs, profit and cash — as a Sankey from the 10-Q filed Oct 27, 2026.
Drawing the Sankey…
Open the interactive Sankey → click any line for what the company wrote about it, compare Y/Y and Q/Q, export as PNG or PDF
What changed this quarter
Revenue was $2.2B in Q3 2026, up 8% year over year and up 19% from the previous quarter. Utility Revenue was the largest line at 93% of revenue. Utility Revenue added $0.12B year over year (up 6%), 77% of the total change.
Operating profit was $0.05B, a 2.2% margin (down 21.6 points year over year). Operating profit fell $0.43B even though revenue rose $0.16B versus Q3 2025, so costs grew faster than sales. Total costs grew 39% against revenue growth of 8%. The quarter ended with a net loss of $0.09B, after a profit of $0.10B the previous quarter. Minority interests bore $0.21B of it: to shareholders the quarter was a profit of $0.12B. Net interest and other expense of $0.16B was the main reason.
Operating cash flow was $0.47B (up 37% year over year). Non-cash charges added back $0.30B of depreciation and amortization. Working capital and other items added $0.26B. Capital expenditures of $0.94B exceeded it, leaving free cash flow of −$0.47B.
Quarterly history
| Quarter | Form | Filed | Revenue | Y/Y | Op. margin | Net earnings | Op. cash flow |
|---|---|---|---|---|---|---|---|
| Q3 2026 | 10-Q | Oct 27, 2026 | $2.2B | +8% | 2.2% | −$91.0M | $471M |
| Q2 2026 | 10-Q | Jul 28, 2026 | $1.8B | -0.5% | 14.4% | $120M | $622M |
| Q1 2026 | 10-Q | Apr 28, 2026 | $2.7B | +12% | 17.9% | $340M | $705M |
| Q4 2025 | 10-K | Feb 10, 2026 | $2.2B | +12% | 19.5% | $289M | $478M |
| Q3 2025 | 10-Q | Oct 30, 2025 | $2.0B | +16% | 23.8% | $277M | $343M |
| Q2 2025 | 10-Q | Jul 31, 2025 | $1.8B | +14% | 17.2% | $201M | $414M |
| Q1 2025 | 10-Q | Apr 24, 2025 | $2.4B | +12% | 20.2% | $304M | $1.0B |
Charts
Interactive views
The same charts as the app — open one to draw it.
💵Where each $1 goesinteractive
Loading the interactive chart…
🌏Named in Asian annual reportsinteractive
Loading the interactive chart…
🔄Rotation against the market and its industry (RRG)interactive
Loading the interactive chart…
🔍Earnings qualityinteractive
Loading the interactive chart…
⚖️Fair value by methodinteractive
Loading the interactive chart…
🔭Outlook & guidanceinteractive
Loading the interactive chart…
📈Investments: gains and what it boughtinteractive
Loading the interactive chart…
🏭Its industry’s money flow (input-output)interactive
Loading the interactive chart…
About CMS Energy
CMS Energy was formed as a corporation in Michigan in 1987 and is an energy company operating primarily in Michigan. It is the parent holding company of several subsidiaries, including Consumers, an electric and gas utility, and NorthStar Clean Energy, primarily a domestic independent power producer and marketer. Consumers’ customer base consists of a mix of primarily residential, commercial, and diversified industrial customers. NorthStar Clean Energy, through its subsidiaries and equity investments, is engaged in domestic independent power production, including the development and operation of renewable generation, and the marketing of independent power production.
In its own words, from its 10-K, filed Feb 10, 2026.
CMS Energy against its Electric & Other Services Combined peers
The largest companies of the same SEC industry, each at its latest quarter. Revenue growth: +8% against the peers' median +8%. Operating margin: 2.2% against the peers' median 20.6%.
| Company | Quarter | Revenue | Y/Y | Op. margin |
|---|---|---|---|---|
| CMS CMS Energy | Q3 2026 | $2.2B | +8% | 2.2% |
| DUK Duke Energy | Q3 2026 | $9.1B | +7% | 30.2% |
| Pepco Holdings LLC | Q3 2026 | $7.3B | +9% | 18.8% |
| EXC Exelon | Q1 2026 | $7.2B | +8% | 22.2% |
| PCG PG&E | Q3 2026 | $6.2B | -1% | 20.2% |
| ED Consolidated Edison | Q3 2026 | $4.9B | +8% | 23.8% |
| XEL Xcel Energy | Q3 2026 | $4.2B | +7% | 28.5% |
| Consolidated Edison Co of New York | Q2 2026 | $4.1B | +13% | 13.6% |
| PEG Public Service Enterprise Group | Q3 2026 | $3.0B | -6% | 20.6% |
Source: CMS Energy 10-Q on SEC EDGAR · CIK 811156 · Electric & Other Services Combined
13F: who owns CMS and who is buying
More on CMS
History
Every quarter: Q3 2026 results · Q2 2026 results · Q1 2026 results · Q4 2025 results · Q3 2025 results · Q2 2025 results · Q1 2025 results