Filing Flows › Consumer Staples › Coty (COTY)
Coty (COTY) earnings and revenue breakdown
Latest: Q1 FY27 · 10-Q filed Nov 5, 2026 · Coty (COTY) Q1 FY27 earnings results →
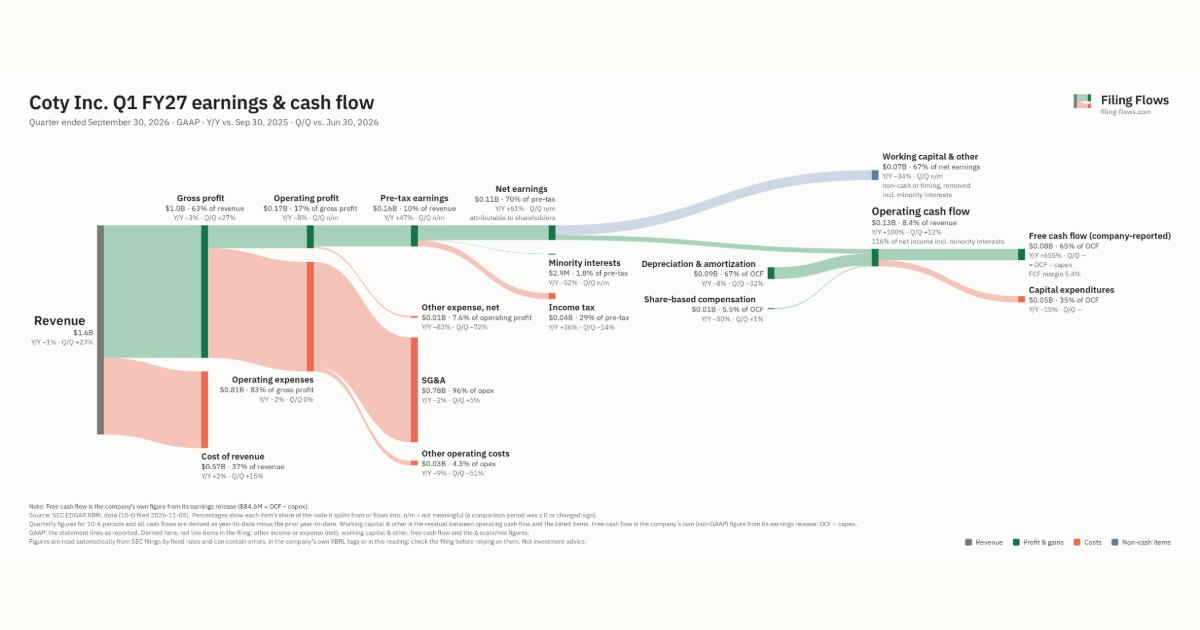
Q1 FY27 Revenue down 1% year over year to $1.6B · 7¢ of every $1 of revenue kept as net profit · operating margin 11.0%
Coty made $1.6B in Q1 FY27 (-1% Y/Y). Operating margin 11.0%, net earnings $110M. See where every dollar goes — costs, profit and cash — as a Sankey from the 10-Q filed Nov 5, 2026.
Drawing the Sankey…
Open the interactive Sankey → click any line for what the company wrote about it, compare Y/Y and Q/Q, export as PNG or PDF
What changed this quarter
Revenue was $1.6B in Q1 FY27, down 1% year over year and up 23% from the previous quarter.
Gross margin was 63.3%, down 1.1 points from Q1 FY26. Operating profit was $0.17B, a 11.0% margin (down 0.8 points year over year). Operating expenses fell 2% while revenue fell 1%. Net earnings were $0.11B, up 61% year over year. The effective tax rate was 28.6%.
Operating cash flow was $0.13B (up 100% year over year), 116% of net income including minority interests. Non-cash charges added back $0.09B of depreciation and amortization and $0.01B of share-based compensation. Working capital and other items used $0.08B. After capital expenditures ($0.05B), free cash flow as the company reports it was $0.08B.
Quarterly history
| Quarter | Form | Filed | Revenue | Y/Y | Op. margin | Net earnings | Op. cash flow |
|---|---|---|---|---|---|---|---|
| Q1 FY27 | 10-Q | Nov 5, 2026 | $1.6B | -1% | 11.0% | $110M | $130M |
| Q4 FY26 | 10-K | Aug 20, 2026 | $1.3B | +1% | -3.4% | −$142M | $116M |
| Q3 FY26 | 10-Q | May 5, 2026 | $1.3B | -1% | -29.0% | −$406M | −$203M |
| Q2 FY26 | 10-Q | Feb 5, 2026 | $1.7B | +0.5% | 8.8% | −$116M | $560M |
| Q1 FY26 | 10-Q | Nov 5, 2025 | $1.6B | -6% | 11.7% | $67.9M | $65.2M |
| Q4 FY25 | 10-K | Aug 21, 2025 | $1.3B | -8% | 1.2% | −$69.3M | $83.2M |
| Q3 FY25 | 10-Q | May 7, 2025 | $1.3B | -6% | -21.6% | −$402M | −$122M |
Charts
Interactive views
The same charts as the app — open one to draw it.
💵Where each $1 goesinteractive
Loading the interactive chart…
🌏Named in Asian annual reportsinteractive
Loading the interactive chart…
🔄Rotation against the market and its industry (RRG)interactive
Loading the interactive chart…
🔍Earnings qualityinteractive
Loading the interactive chart…
⚖️Fair value by methodinteractive
Loading the interactive chart…
🔭Outlook & guidanceinteractive
Loading the interactive chart…
📈Investments: gains and what it boughtinteractive
Loading the interactive chart…
🏭Its industry’s money flow (input-output)interactive
Loading the interactive chart…
About Coty
Founded in 1904, Coty Inc. is one of the world’s largest beauty companies with an iconic portfolio of brands across fragrance, color cosmetics, and skin and body care. We have been engaged in the process of strategic planning and portfolio assessment designed to position the Company for consistent, profitable growth. In September 2025, we announced a strategic review of the Company’s consumer beauty business, including its mass color cosmetics business and associated brands and the Company’s distinct Brazil business comprised of local Brazilian brands. In January 2026, Markus Strobel was appointed as our Executive Chairman and Interim Chief Executive Officer, and in March 2026, the Company’s Board of Directors appointed five new independent directors.
In its own words, from its 10-K, filed Aug 20, 2026.
Coty against its Perfumes, Cosmetics & Other Toilet Preparations peers
The largest companies of the same SEC industry, each at its latest quarter. Revenue growth: -1% against the peers' median +2%. Operating margin: 11.0% against the peers' median 11.0%.
| Company | Quarter | Revenue | Y/Y | Op. margin |
|---|---|---|---|---|
| COTY Coty | Q1 FY27 | $1.6B | -1% | 11.0% |
| CL Colgate Palmolive | Q3 2026 | $5.4B | +5% | 20.3% |
| KVUE Kenvue | Q3 2026 | $3.9B | +3% | 18.2% |
| EL Estee Lauder Companies | Q1 FY27 | $3.7B | +7% | 11.0% |
| EPC Edgewell Personal Care | Q3 FY26 | $570M | +2% | 4.4% |
| ELF e.l.f. Beauty | Q2 FY27 | $521M | +51% | 10.1% |
| IPAR Interparfums | Q3 2026 | $430M | 0% | 27.4% |
| SLSN Solesence | Q2 2026 | $15.3M | -25% | 0.8% |
| AXIL Axil Brands | Q1 FY27 | $6.1M | -11% | 7.2% |
Source: Coty 10-Q on SEC EDGAR · CIK 1024305 · Perfumes, Cosmetics & Other Toilet Preparations
Guidance and outlook
13F: who owns COTY and who is buying
More on COTY
History
Every quarter: Q1 FY27 results · Q4 FY26 results · Q3 FY26 results · Q2 FY26 results · Q1 FY26 results · Q4 FY25 results · Q3 FY25 results