Filing Flows › Consumer Staples › Kenvue (KVUE)
Kenvue (KVUE) earnings and revenue breakdown
Latest: Q3 2026 · 10-Q filed Oct 30, 2026 · Kenvue (KVUE) Q3 2026 earnings results →
Q3 2026 Revenue up 3% year over year to $3.9B · 11¢ of every $1 of revenue kept as net profit · operating margin 18.2%
Kenvue made $3.9B in Q3 2026 (+3% Y/Y): Self Care $1.7B, Essential Health $1.2B, Skin Health and Beauty $1.0B. Operating margin 18.2%, net earnings $430M. See where every dollar goes — costs, profit and cash — as a Sankey from the 10-Q filed Oct 30, 2026.
Drawing the Sankey…
Open the interactive Sankey → click any line for what the company wrote about it, compare Y/Y and Q/Q, export as PNG or PDF
What changed this quarter
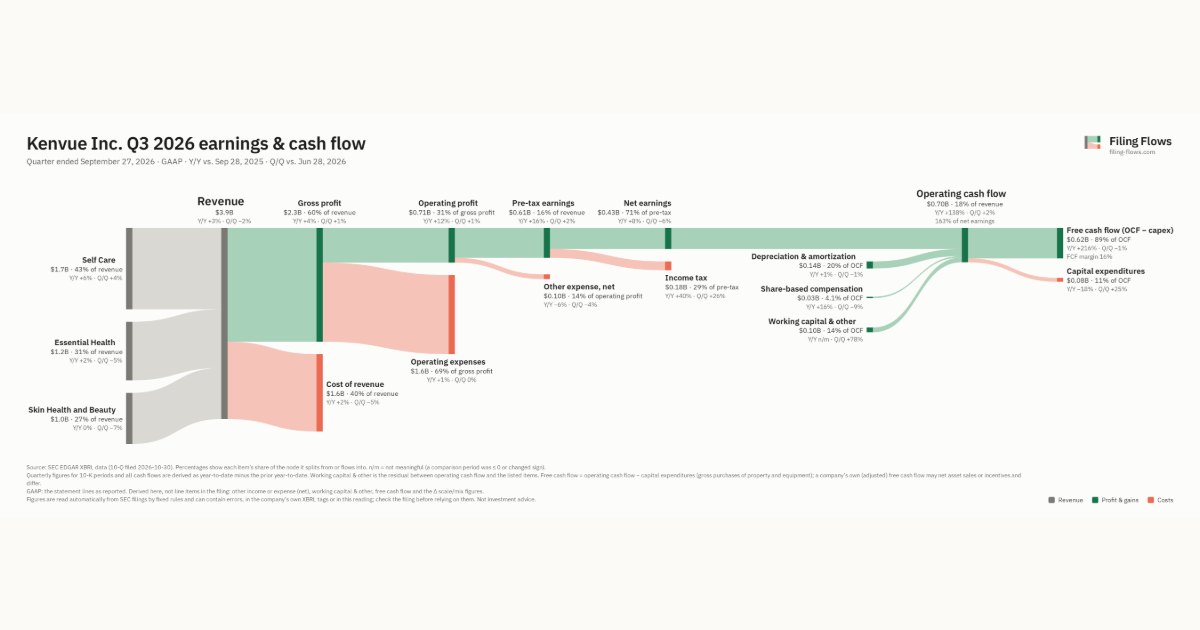
Revenue was $3.9B in Q3 2026, up 3% year over year and down 2% from the previous quarter. Self Care was the largest line at 43% of revenue. Self Care added $0.09B year over year (up 6%), 75% of the total change.
Gross margin was 59.5%, up 0.4 points from Q3 2025. Operating profit was $0.71B, a 18.2% margin (up 1.5 points year over year). Of the extra revenue versus Q3 2025, 63% reached operating profit, above the 17% margin then. Operating expenses grew 1% against revenue growth of 3%. Net earnings were $0.43B, up 8% year over year. The effective tax rate was 29.4%.
Operating cash flow was $0.70B (up 138% year over year), 163% of net earnings. Non-cash charges added back $0.14B of depreciation and amortization and $0.03B of share-based compensation. Working capital and other items added $0.10B. Capital expenditures of $0.08B left free cash flow of $0.62B.
Quarterly history
| Quarter | Form | Filed | Revenue | Y/Y | Op. margin | Net earnings | Op. cash flow |
|---|---|---|---|---|---|---|---|
| Q3 2026 | 10-Q | Oct 30, 2026 | $3.9B | +3% | 18.2% | $430M | $700M |
| Q2 2026 | 10-Q | Aug 6, 2026 | $4.0B | +3% | 17.7% | $456M | $688M |
| Q1 2026 | 10-Q | May 7, 2026 | $3.9B | +4% | 19.6% | $474M | $489M |
| Q4 2025 | 10-K | Feb 20, 2026 | $3.8B | +3% | 14.2% | $330M | $854M |
| Q3 2025 | 10-Q | Nov 3, 2025 | $3.8B | -4% | 16.7% | $398M | $294M |
| Q2 2025 | 10-Q | Aug 7, 2025 | $3.8B | -4% | 18.0% | $420M | $621M |
| Q1 2025 | 10-Q | May 8, 2025 | $3.7B | -4% | 14.9% | $322M | $428M |
Charts
Interactive views
The same charts as the app — open one to draw it.
💵Where each $1 goesinteractive
Loading the interactive chart…
🌏Named in Asian annual reportsinteractive
Loading the interactive chart…
🔄Rotation against the market and its industry (RRG)interactive
Loading the interactive chart…
🔍Earnings qualityinteractive
Loading the interactive chart…
⚖️Fair value by methodinteractive
Loading the interactive chart…
🔭Outlook & guidanceinteractive
Loading the interactive chart…
📈Investments: gains and what it boughtinteractive
Loading the interactive chart…
🏭Its industry’s money flow (input-output)interactive
Loading the interactive chart…
About Kenvue
At Kenvue, our purpose is to realize the extraordinary power of everyday care. As a global leader at the intersection of healthcare and consumer goods, we are the world’s largest pure-play consumer health company by revenue with $15.1 billion in Net sales in the fiscal year 2025. By combining the power of science with meaningful consumer insights and our digital strategy, we empower consumers to live healthier lives every day. Built on more than a century of heritage and trusted by generations, our differentiated portfolio of iconic brands—including Aveeno ® , BAND-AID ® Brand, Johnson’s ® , Listerine ® , Neutrogena ® , Nicorette ® , Tylenol ® , and Zyrtec ® —is backed by science and recommended by healthcare professionals, which further reinforces our consumers’ connections to our brands.
In its own words, from its 10-K, filed Feb 20, 2026.
Kenvue against its Perfumes, Cosmetics & Other Toilet Preparations peers
The largest companies of the same SEC industry, each at its latest quarter. Revenue growth: +3% against the peers' median +2%. Operating margin: 18.2% against the peers' median 11.0%.
| Company | Quarter | Revenue | Y/Y | Op. margin |
|---|---|---|---|---|
| KVUE Kenvue | Q3 2026 | $3.9B | +3% | 18.2% |
| CL Colgate Palmolive | Q3 2026 | $5.4B | +5% | 20.3% |
| EL Estee Lauder Companies | Q1 FY27 | $3.7B | +7% | 11.0% |
| COTY Coty | Q1 FY27 | $1.6B | -1% | 11.0% |
| EPC Edgewell Personal Care | Q3 FY26 | $570M | +2% | 4.4% |
| ELF e.l.f. Beauty | Q2 FY27 | $521M | +51% | 10.1% |
| IPAR Interparfums | Q3 2026 | $430M | 0% | 27.4% |
| SLSN Solesence | Q2 2026 | $15.3M | -25% | 0.8% |
| AXIL Axil Brands | Q1 FY27 | $6.1M | -11% | 7.2% |
Source: Kenvue 10-Q on SEC EDGAR · CIK 1944048 · Perfumes, Cosmetics & Other Toilet Preparations
Guidance and outlook
13F: who owns KVUE and who is buying
More on KVUE
- How Kenvue makes money: revenue by segment
- Kenvue next earnings date and what analysts expect
- Kenvue stock forecast, price target and fair value
- Who owns Kenvue stock: holders, funds and Congress trades
- Kenvue guidance and outlook
- Is Kenvue a takeover target? LBO and rumors
- Kenvue recalls, complaints and regulation
History
Every quarter: Q3 2026 results · Q2 2026 results · Q1 2026 results · Q4 2025 results · Q3 2025 results · Q2 2025 results · Q1 2025 results