Filing Flows › Financials › Fifth Third Bancorp (FITB)
Fifth Third Bancorp (FITB) earnings and revenue breakdown
Latest: Q3 2026 · 10-Q filed Nov 3, 2026 · Fifth Third Bancorp (FITB) Q3 2026 earnings results →
Q3 2026 Revenue up 42% year over year to $3.3B · 26¢ of every $1 of revenue kept as net profit · operating margin 33.8%
Fifth Third Bancorp made $3.3B in Q3 2026 (+42% Y/Y): Net interest income $2.3B, Noninterest income $1.0B. Operating margin 33.8%, net earnings $866M. See where every dollar goes — costs, profit and cash — as a Sankey from the 10-Q filed Nov 3, 2026.
Drawing the Sankey…
Open the interactive Sankey → click any line for what the company wrote about it, compare Y/Y and Q/Q, export as PNG or PDF
What changed this quarter
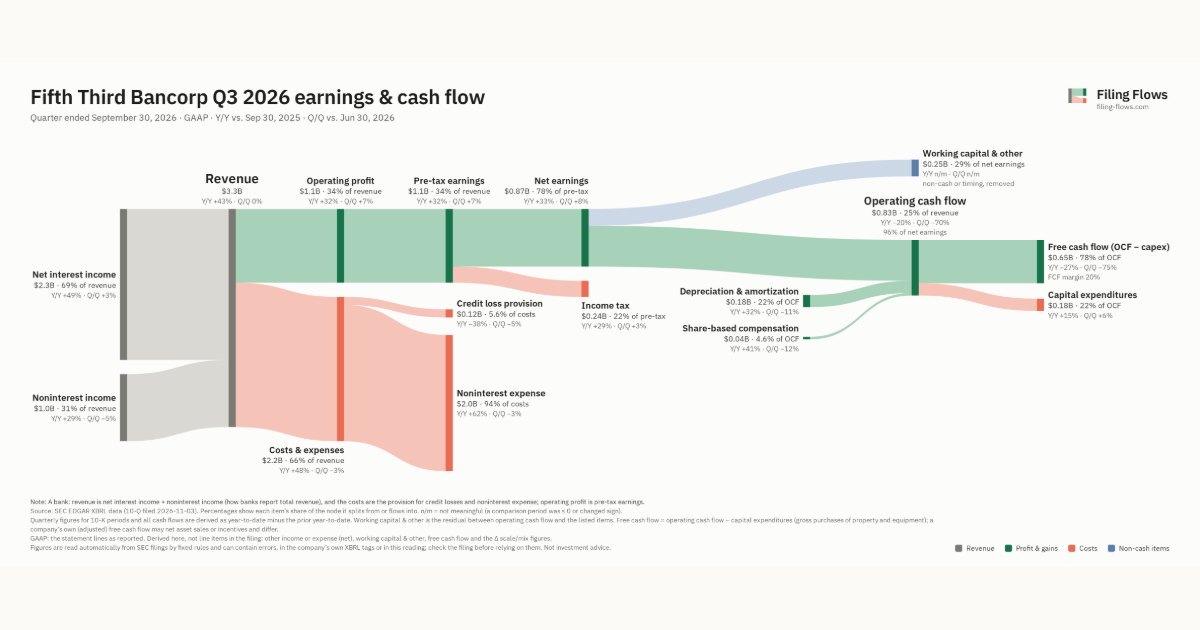
Revenue was $3.3B in Q3 2026, up 43% year over year and roughly flat from the previous quarter. Net interest income was the largest line at 69% of revenue. Net interest income added $0.75B year over year (up 49%), 77% of the total change.
Operating profit was $1.1B, a 33.8% margin (down 2.6 points year over year). Of the extra revenue versus a year earlier, 28% reached operating profit, below the 36% margin then. Total costs grew 48% against revenue growth of 43%. The fastest-growing cost line was Noninterest expense (+62%). Net earnings were $0.87B, up 33% year over year. The effective tax rate was 21.8%.
Operating cash flow was $0.83B (down 20% year over year), 96% of net earnings. Non-cash charges added back $0.18B of depreciation and amortization and $0.04B of share-based compensation. Working capital and other items used $0.25B. Capital expenditures of $0.18B left free cash flow of $0.65B.
Quarterly history
| Quarter | Form | Filed | Revenue | Y/Y | Op. margin | Net earnings | Op. cash flow |
|---|---|---|---|---|---|---|---|
| Q3 2026 | 10-Q | Nov 3, 2026 | $3.3B | +42% | 33.8% | $866M | $835M |
Charts
Interactive views
The same charts as the app — open one to draw it.
💵Where each $1 goesinteractive
Loading the interactive chart…
🌏Named in Asian annual reportsinteractive
Loading the interactive chart…
🔄Rotation against the market and its industry (RRG)interactive
Loading the interactive chart…
🔍Earnings qualityinteractive
Loading the interactive chart…
⚖️Fair value by methodinteractive
Loading the interactive chart…
🔭Outlook & guidanceinteractive
Loading the interactive chart…
📈Investments: gains and what it boughtinteractive
Loading the interactive chart…
🏭Its industry’s money flow (input-output)interactive
Loading the interactive chart…
About Fifth Third Bancorp
Fifth Third Bancorp (the “Bancorp” or “Fifth Third”), an Ohio corporation organized in 1975, is a bank holding company (“BHC”) as defined by the Bank Holding Company Act of 1956, as amended (the “BHCA”), and has elected to be treated as a financial holding company (“FHC”) under the Gramm-Leach-Bliley Act of 1999 (“GLBA”) and regulations of the Board of Governors of the Federal Reserve System (the “FRB”). The Bancorp is a diversified financial services company headquartered in Cincinnati, Ohio and is the indirect holding company of Fifth Third Bank, National Association (the “Bank”). As of December 31, 2025, Fifth Third had $214 billion in assets and operates 1,130 full-service Banking Centers and 2,199 Fifth Third branded ATMs in Ohio, Kentucky, Indiana, Michigan, Illinois, Florida, Tennessee, West Virginia, Georgia, North Carolina, South Carolina and Alabama.
In its own words, from its 10-K, filed Feb 24, 2026.
Fifth Third Bancorp against its State Commercial Banks peers
The largest companies of the same SEC industry, each at its latest quarter. Revenue growth: +42% against the peers' median +10%. Operating margin: 33.8% against the peers' median 34.6%.
| Company | Quarter | Revenue | Y/Y | Op. margin |
|---|---|---|---|---|
| FITB Fifth Third Bancorp | Q3 2026 | $3.3B | +42% | 33.8% |
| BNY Bank of New York Mellon | Q3 2026 | $5.7B | +12% | 38.5% |
| STT State Street | Q3 2026 | $4.0B | +13% | 34.7% |
| MTB M&T Bank | Q3 2026 | $2.5B | +0.9% | 39.7% |
| FCNCA First Citizens Bancshares | Q3 2026 | $2.4B | 0% | 33.1% |
| ALLY Ally Financial | Q3 2026 | $2.3B | +8% | 24.3% |
| CFG Citizens Financial Group | Q3 2026 | $2.3B | +10% | 34.6% |
| NTRS Northern Trust | Q3 2026 | $2.3B | +13% | 34.7% |
| WAL Western Alliance Bancorporation | Q3 2026 | $1.0B | +8% | 33.4% |
Source: Fifth Third Bancorp 10-Q on SEC EDGAR · CIK 35527 · State Commercial Banks
13F: who owns FITB and who is buying
More on FITB
History
Every quarter: Q3 2026 results