Filing Flows › Financials › State Street (STT)
State Street (STT) earnings and revenue breakdown
Latest: Q3 2026 · 10-Q filed Oct 28, 2026 · State Street (STT) Q3 2026 earnings results →
Q3 2026 Revenue up 13% year over year to $4.0B · 27¢ of every $1 of revenue kept as net profit · operating margin 34.7%
State Street made $4.0B in Q3 2026 (+13% Y/Y): Total fee revenue $3.1B, Net interest income $864M. Operating margin 34.7%, net earnings $1.1B. See where every dollar goes — costs, profit and cash — as a Sankey from the 10-Q filed Oct 28, 2026.
Drawing the Sankey…
Open the interactive Sankey → click any line for what the company wrote about it, compare Y/Y and Q/Q, export as PNG or PDF
What changed this quarter
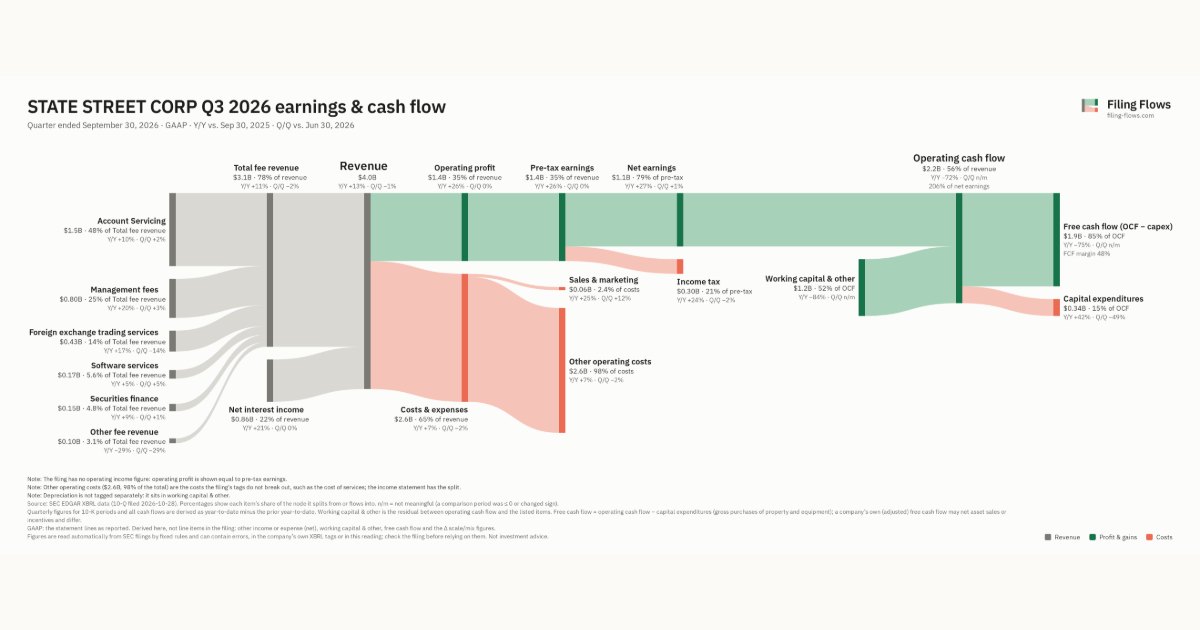
Revenue was $4.0B in Q3 2026, up 13% year over year and down 1% from the previous quarter. Account Servicing was the largest line at 37% of revenue. Net interest income added $0.15B year over year (up 21%), 32% of the total change. Other fee revenue declined 29%.
Operating profit was $1.4B, a 34.7% margin (up 3.6 points year over year). Of the extra revenue versus Q3 2025, 62% reached operating profit, above the 31% margin then. Total costs grew 7% against revenue growth of 13%. The fastest-growing cost line was Sales & marketing (+25%). Net earnings were $1.1B, up 27% year over year. The effective tax rate was 21.5%.
Operating cash flow was $2.2B (down 72% year over year), 206% of net earnings. Working capital and other items added $1.2B. Capital expenditures of $0.34B left free cash flow of $1.9B.
Quarterly history
| Quarter | Form | Filed | Revenue | Y/Y | Op. margin | Net earnings | Op. cash flow |
|---|---|---|---|---|---|---|---|
| Q3 2026 | 10-Q | Oct 28, 2026 | $4.0B | +13% | 34.7% | $1.1B | $2.2B |
| Q2 2026 | 10-Q | Jul 30, 2026 | $4.0B | +17% | 34.3% | $1.1B | −$2.3B |
| Q1 2026 | 10-Q | Apr 29, 2026 | $3.8B | +16% | 25.5% | $764M | −$12.1B |
| Q4 2025 | 10-K | Feb 19, 2026 | $3.7B | +8% | 25.0% | $747M | $10.0B |
| Q3 2025 | 10-Q | Oct 30, 2025 | $3.5B | +9% | 31.1% | $861M | $7.9B |
| Q2 2025 | 10-Q | Jul 31, 2025 | $3.4B | +8% | 25.8% | $693M | −$8.4B |
| Q1 2025 | 10-Q | May 1, 2025 | $3.3B | +5% | 25.0% | $644M | $2.4B |
Charts
Interactive views
The same charts as the app — open one to draw it.
💵Where each $1 goesinteractive
Loading the interactive chart…
🌏Named in Asian annual reportsinteractive
Loading the interactive chart…
🔄Rotation against the market and its industry (RRG)interactive
Loading the interactive chart…
🔍Earnings qualityinteractive
Loading the interactive chart…
⚖️Fair value by methodinteractive
Loading the interactive chart…
🔭Outlook & guidanceinteractive
Loading the interactive chart…
📈Investments: gains and what it boughtinteractive
Loading the interactive chart…
🏭Its industry’s money flow (input-output)interactive
Loading the interactive chart…
About State Street
State Street Corporation is one of the world’s leading providers of financial services to institutional investors, including investment servicing, markets and financing solutions and investment management. Our clients — asset managers and owners, insurance companies, wealth managers, official institutions and central banks — rely on us to deliver solutions that support their business objectives across the investment life cycle. Leveraging our strength and scale, innovation and platforms, and industry expertise, we are an essential partner to our clients. In all aspects of our business, we work toward a singular purpose: to help create better outcomes for the world’s investors and the people they serve.
In its own words, from its 10-K, filed Feb 19, 2026.
State Street against its State Commercial Banks peers
The largest companies of the same SEC industry, each at its latest quarter. Revenue growth: +13% against the peers' median +10%. Operating margin: 34.7% against the peers' median 34.6%.
| Company | Quarter | Revenue | Y/Y | Op. margin |
|---|---|---|---|---|
| STT State Street | Q3 2026 | $4.0B | +13% | 34.7% |
| BNY Bank of New York Mellon | Q3 2026 | $5.7B | +12% | 38.5% |
| FITB Fifth Third Bancorp | Q3 2026 | $3.3B | +42% | 33.8% |
| MTB M&T Bank | Q3 2026 | $2.5B | +0.9% | 39.7% |
| FCNCA First Citizens Bancshares | Q3 2026 | $2.4B | 0% | 33.1% |
| ALLY Ally Financial | Q3 2026 | $2.3B | +8% | 24.3% |
| CFG Citizens Financial Group | Q3 2026 | $2.3B | +10% | 34.6% |
| NTRS Northern Trust | Q3 2026 | $2.3B | +13% | 34.7% |
| WAL Western Alliance Bancorporation | Q3 2026 | $1.0B | +8% | 33.4% |
Source: State Street 10-Q on SEC EDGAR · CIK 93751 · State Commercial Banks
13F: who owns STT and who is buying
More on STT
History
Every quarter: Q3 2026 results · Q2 2026 results · Q1 2026 results · Q4 2025 results · Q3 2025 results · Q2 2025 results · Q1 2025 results