Filing Flows › Financials › Ally Financial (ALLY)
Ally Financial (ALLY) earnings and revenue breakdown
Latest: Q3 2026 · 10-Q filed Nov 2, 2026 · Ally Financial (ALLY) Q3 2026 earnings results →
Q3 2026 Revenue up 8% year over year to $2.3B · 19¢ of every $1 of revenue kept as net profit · operating margin 24.3%
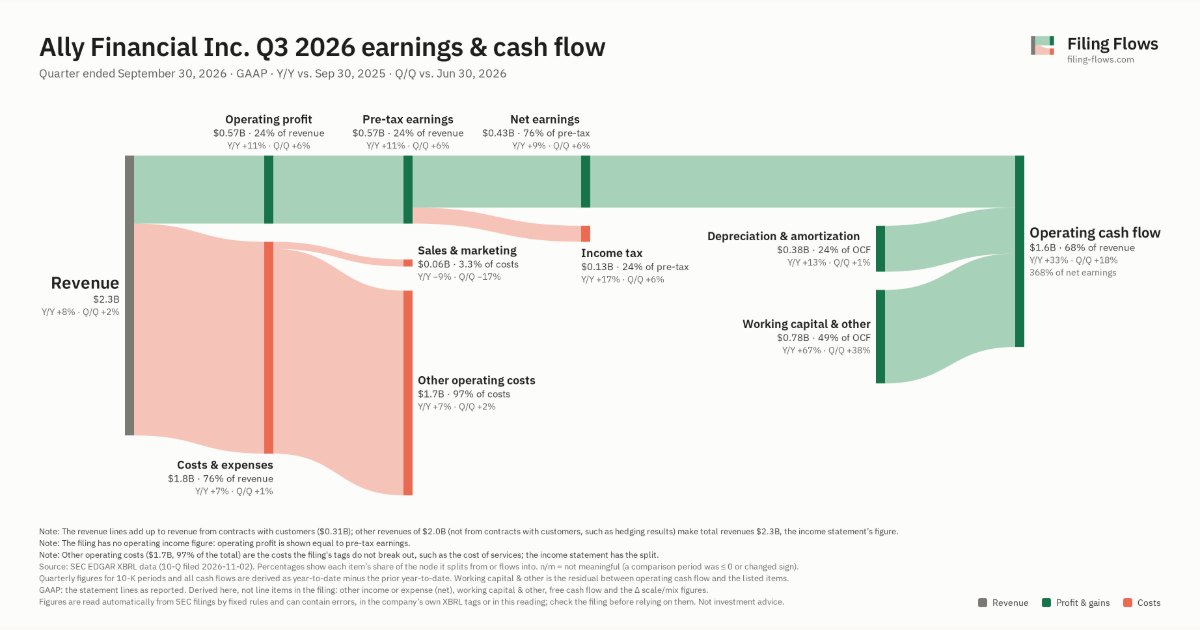
Ally Financial made $2.3B in Q3 2026 (+8% Y/Y). Operating margin 24.3%, net earnings $433M. See where every dollar goes — costs, profit and cash — as a Sankey from the 10-Q filed Nov 2, 2026.
Drawing the Sankey…
Open the interactive Sankey → click any line for what the company wrote about it, compare Y/Y and Q/Q, export as PNG or PDF
What changed this quarter
Revenue was $2.3B in Q3 2026, up 8% year over year and up 2% from the previous quarter.
Operating profit was $0.57B, a 24.3% margin (up 0.7 points year over year). Of the extra revenue versus Q3 2025, 33% reached operating profit, above the 24% margin then. Total costs grew 7% against revenue growth of 8%. Net earnings were $0.43B, up 9% year over year. The effective tax rate was 23.6%.
Operating cash flow was $1.6B (up 33% year over year), 368% of net earnings. Non-cash charges added back $0.38B of depreciation and amortization. Working capital and other items added $0.78B.
Quarterly history
| Quarter | Form | Filed | Revenue | Y/Y | Op. margin | Net earnings | Op. cash flow |
|---|---|---|---|---|---|---|---|
| Q3 2026 | 10-Q | Nov 2, 2026 | $2.3B | +8% | 24.3% | $433M | $1.6B |
| Q2 2026 | 10-Q | Jul 23, 2026 | $2.3B | +10% | 23.5% | $410M | $1.4B |
| Q1 2026 | 10-Q | May 5, 2026 | $2.1B | +36% | 19.0% | $319M | $1.4B |
| Q4 2025 | 10-K | Feb 25, 2026 | $2.1B | +5% | 18.2% | $327M | $640M |
| Q3 2025 | 10-Q | Oct 30, 2025 | $2.2B | +2% | 23.7% | $398M | $1.2B |
| Q2 2025 | 10-Q | Aug 4, 2025 | $2.1B | +3% | 20.9% | $352M | $947M |
| Q1 2025 | 10-Q | May 5, 2025 | $1.5B | -23% | -18.4% | −$225M | $940M |
Charts
Interactive views
The same charts as the app — open one to draw it.
💵Where each $1 goesinteractive
Loading the interactive chart…
🌏Named in Asian annual reportsinteractive
Loading the interactive chart…
🔄Rotation against the market and its industry (RRG)interactive
Loading the interactive chart…
🔍Earnings qualityinteractive
Loading the interactive chart…
⚖️Fair value by methodinteractive
Loading the interactive chart…
🔭Outlook & guidanceinteractive
Loading the interactive chart…
📈Investments: gains and what it boughtinteractive
Loading the interactive chart…
🏭Its industry’s money flow (input-output)interactive
Loading the interactive chart…
Customers and suppliers named in filings
Buys from
About Ally Financial
Ally Financial Inc. (together with its consolidated subsidiaries unless the context otherwise requires, Ally, the Company, we, us, or our) is a financial-services company with $196.0 billion in assets as of December 31, 2025. The Company comprises the nation’s largest all-digital bank and an industry-leading automotive financing and insurance business, driven by a mission to “Do It Right” and be a relentless ally for all stakeholders. The Company serves customers with deposits and securities brokerage and investment advisory services as well as automotive financing and insurance offerings. The Company also includes a seasoned corporate finance business that offers capital for equity sponsors and middle-market companies.
In its own words, from its 10-K, filed Feb 25, 2026.
Ally Financial against its State Commercial Banks peers
The largest companies of the same SEC industry, each at its latest quarter. Revenue growth: +8% against the peers' median +10%. Operating margin: 24.3% against the peers' median 34.6%.
| Company | Quarter | Revenue | Y/Y | Op. margin |
|---|---|---|---|---|
| ALLY Ally Financial | Q3 2026 | $2.3B | +8% | 24.3% |
| BNY Bank of New York Mellon | Q3 2026 | $5.7B | +12% | 38.5% |
| STT State Street | Q3 2026 | $4.0B | +13% | 34.7% |
| FITB Fifth Third Bancorp | Q3 2026 | $3.3B | +42% | 33.8% |
| MTB M&T Bank | Q3 2026 | $2.5B | +0.9% | 39.7% |
| FCNCA First Citizens Bancshares | Q3 2026 | $2.4B | 0% | 33.1% |
| CFG Citizens Financial Group | Q3 2026 | $2.3B | +10% | 34.6% |
| NTRS Northern Trust | Q3 2026 | $2.3B | +13% | 34.7% |
| WAL Western Alliance Bancorporation | Q3 2026 | $1.0B | +8% | 33.4% |
Source: Ally Financial 10-Q on SEC EDGAR · CIK 40729 · State Commercial Banks
Guidance and outlook
13F: who owns ALLY and who is buying
More on ALLY
History
Every quarter: Q3 2026 results · Q2 2026 results · Q1 2026 results · Q4 2025 results · Q3 2025 results · Q2 2025 results · Q1 2025 results