Filing Flows › Financials › M&T Bank (MTB)
M&T Bank (MTB) earnings and revenue breakdown
Latest: Q3 2026 · 10-Q filed Nov 5, 2026 · M&T Bank (MTB) Q3 2026 earnings results →
Q3 2026 Revenue up 1% year over year to $2.5B · 31¢ of every $1 of revenue kept as net profit · operating margin 39.7%
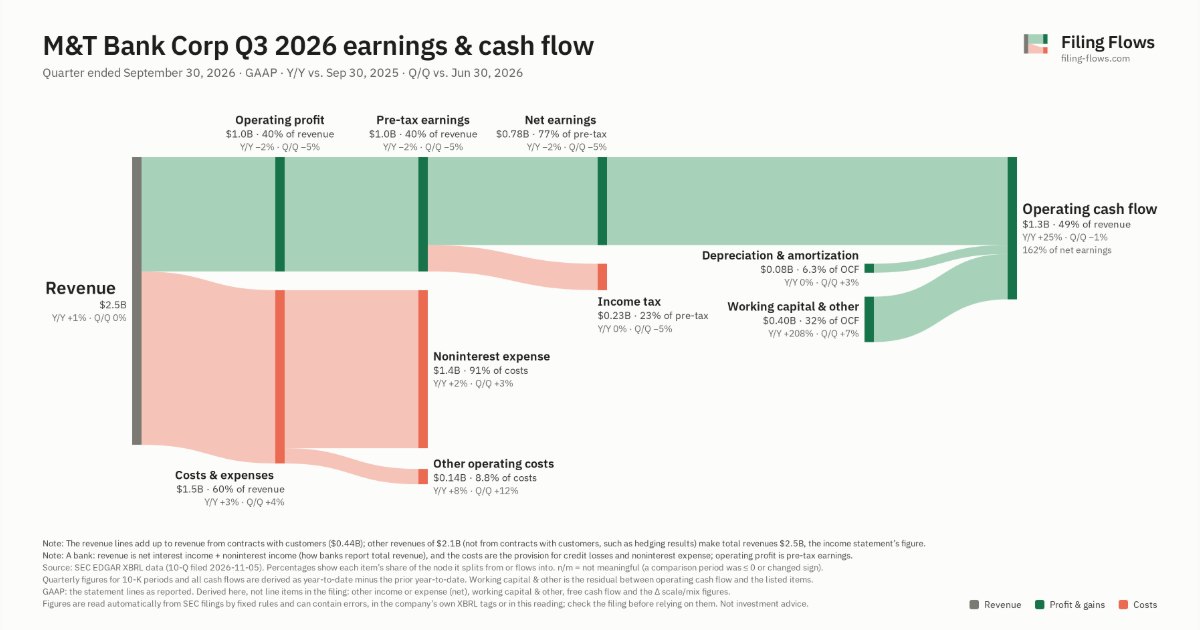
M&T Bank made $2.5B in Q3 2026 (+0.9% Y/Y). Operating margin 39.7%, net earnings $775M. See where every dollar goes — costs, profit and cash — as a Sankey from the 10-Q filed Nov 5, 2026.
Drawing the Sankey…
Open the interactive Sankey → click any line for what the company wrote about it, compare Y/Y and Q/Q, export as PNG or PDF
What changed this quarter
Revenue was $2.5B in Q3 2026, up 1% year over year and roughly flat from the previous quarter.
Operating profit was $1.0B, a 39.7% margin (down 1.0 points year over year). Operating profit fell $0.02B even though revenue rose $0.02B versus Q3 2025, so costs grew faster than sales. Total costs grew 3% against revenue growth of 1%. Net earnings were $0.78B, down 2% year over year. The effective tax rate was 23.1%.
Operating cash flow was $1.3B (up 25% year over year), 162% of net earnings. Non-cash charges added back $0.08B of depreciation and amortization. Working capital and other items added $0.40B.
Quarterly history
| Quarter | Form | Filed | Revenue | Y/Y | Op. margin | Net earnings | Op. cash flow |
|---|---|---|---|---|---|---|---|
| Q3 2026 | 10-Q | Nov 5, 2026 | $2.5B | +0.9% | 39.7% | $775M | $1.3B |
| Q2 2026 | 10-Q | Aug 4, 2026 | $2.5B | +6% | 42.0% | $818M | $1.3B |
| Q1 2026 | 10-Q | May 5, 2026 | $2.4B | +6% | 35.4% | $664M | $1.0B |
| Q4 2025 | 10-K | Feb 18, 2026 | $2.5B | +4% | 39.2% | $759M | $523M |
| Q3 2025 | 10-Q | Oct 27, 2025 | $2.5B | +8% | 40.8% | $792M | $1.0B |
| Q2 2025 | 10-Q | Aug 4, 2025 | $2.4B | +4% | 39.0% | $716M | $844M |
| Q1 2025 | 10-Q | May 5, 2025 | $2.3B | +2% | 33.0% | $584M | $635M |
Charts
Interactive views
The same charts as the app — open one to draw it.
💵Where each $1 goesinteractive
Loading the interactive chart…
🌏Named in Asian annual reportsinteractive
Loading the interactive chart…
🔄Rotation against the market and its industry (RRG)interactive
Loading the interactive chart…
🔍Earnings qualityinteractive
Loading the interactive chart…
⚖️Fair value by methodinteractive
Loading the interactive chart…
🔭Outlook & guidanceinteractive
Loading the interactive chart…
📈Investments: gains and what it boughtinteractive
Loading the interactive chart…
🏭Its industry’s money flow (input-output)interactive
Loading the interactive chart…
About M&T Bank
M&T is a New York business corporation that has elected to be treated as an FHC under the BHCA and is a BHC under Article III-A of the New York Banking Law. M&T was incorporated in November 1969. At December 31, 2025, M&T had two wholly-owned bank subsidiaries: M&T Bank and Wilmington Trust, N.A. The banks collectively offer a wide range of retail and commercial banking, wealth management, trust and institutional services to their customers. The Company had consolidated total assets of $213.5 billion, deposits of $166.9 billion and shareholders’ equity of $29.2 billion at December 31, 2025. The principal executive offices of M&T and M&T Bank are located in Buffalo, New York.
In its own words, from its 10-K, filed Feb 18, 2026.
M&T Bank against its State Commercial Banks peers
The largest companies of the same SEC industry, each at its latest quarter. Revenue growth: +0.9% against the peers' median +10%. Operating margin: 39.7% against the peers' median 34.6%.
| Company | Quarter | Revenue | Y/Y | Op. margin |
|---|---|---|---|---|
| MTB M&T Bank | Q3 2026 | $2.5B | +0.9% | 39.7% |
| BNY Bank of New York Mellon | Q3 2026 | $5.7B | +12% | 38.5% |
| STT State Street | Q3 2026 | $4.0B | +13% | 34.7% |
| FITB Fifth Third Bancorp | Q3 2026 | $3.3B | +42% | 33.8% |
| FCNCA First Citizens Bancshares | Q3 2026 | $2.4B | 0% | 33.1% |
| ALLY Ally Financial | Q3 2026 | $2.3B | +8% | 24.3% |
| CFG Citizens Financial Group | Q3 2026 | $2.3B | +10% | 34.6% |
| NTRS Northern Trust | Q3 2026 | $2.3B | +13% | 34.7% |
| WAL Western Alliance Bancorporation | Q3 2026 | $1.0B | +8% | 33.4% |
Source: M&T Bank 10-Q on SEC EDGAR · CIK 36270 · State Commercial Banks
Guidance and outlook
13F: who owns MTB and who is buying
More on MTB
History
Every quarter: Q3 2026 results · Q2 2026 results · Q1 2026 results · Q4 2025 results · Q3 2025 results · Q2 2025 results · Q1 2025 results