Filing Flows › Industrials › Hunt J B Transport Services (JBHT)
Hunt J B Transport Services (JBHT) earnings and revenue breakdown
Latest: Q3 2026 · 10-Q filed Oct 23, 2026 · Hunt J B Transport Services (JBHT) Q3 2026 earnings results →
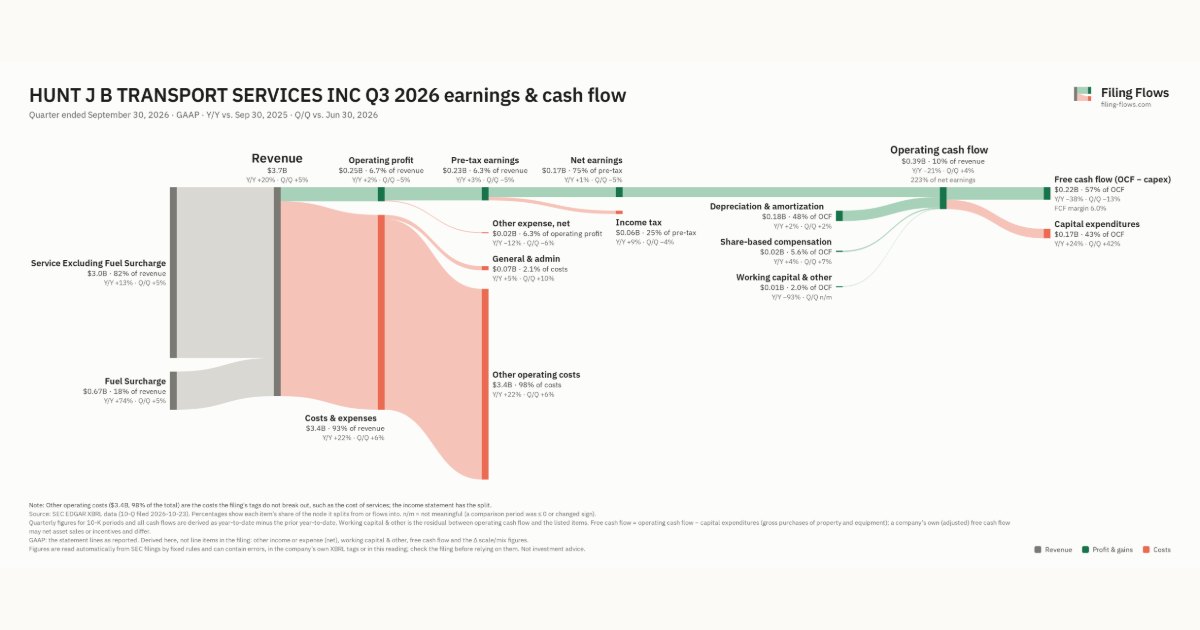
Q3 2026 Revenue up 20% year over year to $3.7B · 5¢ of every $1 of revenue kept as net profit · operating margin 6.7%
Hunt J B Transport Services made $3.7B in Q3 2026 (+20% Y/Y): Service Excluding Fuel Surcharge $3.0B, Fuel Surcharge $671M. Operating margin 6.7%, net earnings $172M. See where every dollar goes — costs, profit and cash — as a Sankey from the 10-Q filed Oct 23, 2026.
Drawing the Sankey…
Open the interactive Sankey → click any line for what the company wrote about it, compare Y/Y and Q/Q, export as PNG or PDF
What changed this quarter
Revenue was $3.7B in Q3 2026, up 20% year over year and up 5% from the previous quarter. Service Excluding Fuel Surcharge was the largest line at 82% of revenue. Service Excluding Fuel Surcharge added $0.34B year over year (up 13%), 54% of the total change.
Operating profit was $0.25B, a 6.7% margin (down 1.2 points year over year). Of the extra revenue versus Q3 2025, 1% reached operating profit, below the 8% margin then. Total costs grew 22% against revenue growth of 20%. The fastest-growing cost line was Other operating costs (+22%). Net earnings were $0.17B, up 1% year over year. The effective tax rate was 25.5%.
Operating cash flow was $0.39B (down 21% year over year), 223% of net earnings. Non-cash charges added back $0.18B of depreciation and amortization and $0.02B of share-based compensation. Capital expenditures of $0.17B left free cash flow of $0.22B.
Quarterly history
| Quarter | Form | Filed | Revenue | Y/Y | Op. margin | Net earnings | Op. cash flow |
|---|---|---|---|---|---|---|---|
| Q3 2026 | 10-Q | Oct 23, 2026 | $3.7B | +20% | 6.7% | $172M | $385M |
| Q2 2026 | 10-Q | Jul 24, 2026 | $3.5B | +19% | 7.4% | $181M | $370M |
| Q1 2026 | 10-Q | Apr 24, 2026 | $3.1B | +5% | 6.8% | $142M | $353M |
| Q4 2025 | 10-K | Feb 24, 2026 | $3.1B | -2% | 8.0% | $181M | $386M |
| Q3 2025 | 10-Q | Oct 24, 2025 | $3.1B | -0.5% | 7.9% | $171M | $486M |
| Q2 2025 | 10-Q | Jul 24, 2025 | $2.9B | 0% | 6.7% | $129M | $402M |
| Q1 2025 | 10-Q | Apr 25, 2025 | $2.9B | -0.8% | 6.1% | $118M | $404M |
Charts
Interactive views
The same charts as the app — open one to draw it.
💵Where each $1 goesinteractive
Loading the interactive chart…
🌏Named in Asian annual reportsinteractive
Loading the interactive chart…
🔄Rotation against the market and its industry (RRG)interactive
Loading the interactive chart…
🔍Earnings qualityinteractive
Loading the interactive chart…
⚖️Fair value by methodinteractive
Loading the interactive chart…
🔭Outlook & guidanceinteractive
Loading the interactive chart…
📈Investments: gains and what it boughtinteractive
Loading the interactive chart…
🏭Its industry’s money flow (input-output)interactive
Loading the interactive chart…
About Hunt J B Transport Services
We are one of the largest surface transportation, delivery, and logistics companies in North America. J.B. Hunt Transport Services, Inc. is a publicly held holding company that, through our wholly owned subsidiaries, provides a wide range of reliable transportation, brokerage, and delivery services to a diverse group of customers and consumers throughout the continental United States, Canada, and Mexico. Unless otherwise indicated by the context, “we,” “us,” “our,” the “Company”, and “JBHT” refer to J.B. Hunt Transport Services, Inc. and its consolidated subsidiaries. We were incorporated in Arkansas on August 10, 1961, and have been a publicly held company since our initial public offering in 1983.
In its own words, from its 10-K, filed Feb 24, 2026.
Hunt J B Transport Services against its Trucking (No Local) peers
The largest companies of the same SEC industry, each at its latest quarter. Revenue growth: +20% against the peers' median +16%. Operating margin: 6.7% against the peers' median 6.7%.
| Company | Quarter | Revenue | Y/Y | Op. margin |
|---|---|---|---|---|
| JBHT Hunt J B Transport Services | Q3 2026 | $3.7B | +20% | 6.7% |
| KNX Knight-Swift Transportation Holdings | Q3 2026 | $2.2B | +14% | 8.1% |
| ODFL Old Dominion Freight Line | Q3 2026 | $1.6B | +13% | 28.5% |
| SNDR Schneider National | Q3 2026 | $1.6B | +9% | 3.9% |
| LSTR Landstar System | Q3 2026 | $1.5B | +25% | 4.3% |
| ARCB Arcbest | Q3 2026 | $1.2B | +16% | 6.1% |
| SAIA Saia | Q3 2026 | $982M | +17% | 12.4% |
| WERN Werner Enterprises | Q3 2026 | $951M | +23% | 1.8% |
| ULH Universal Logistics Holdings | Q3 2026 | $394M | -0.7% | 8.3% |
Source: Hunt J B Transport Services 10-Q on SEC EDGAR · CIK 728535 · Trucking (No Local)
13F: who owns JBHT and who is buying
More on JBHT
- How Hunt J B Transport Services makes money: revenue by segment
- Hunt J B Transport Services stock forecast, price target and fair value
- Who owns Hunt J B Transport Services stock: holders, funds and Congress trades
- Hunt J B Transport Services guidance and outlook
- Is Hunt J B Transport Services a takeover target? LBO and rumors
History
Every quarter: Q3 2026 results · Q2 2026 results · Q1 2026 results · Q4 2025 results · Q3 2025 results · Q2 2025 results · Q1 2025 results
- Hunt J B Transport Services guidance history: guided vs reported
- Hunt J B Transport Services operating margin by quarter
- Hunt J B Transport Services net income by quarter
- Hunt J B Transport Services free cash flow by quarter
- Hunt J B Transport Services capital expenditures by quarter
- Hunt J B Transport Services Service Excluding Fuel Surcharge revenue by quarter
- Hunt J B Transport Services Fuel Surcharge revenue by quarter