Filing Flows › Industrials › Maximus (MMS)
Maximus (MMS) earnings and revenue breakdown
Latest: Q3 FY26 · 10-Q filed Aug 6, 2026 · Maximus (MMS) Q3 FY26 earnings results →
Q3 FY26 Revenue down 5% year over year to $1.3B · 8¢ of every $1 of revenue kept as net profit · operating margin 12.6%
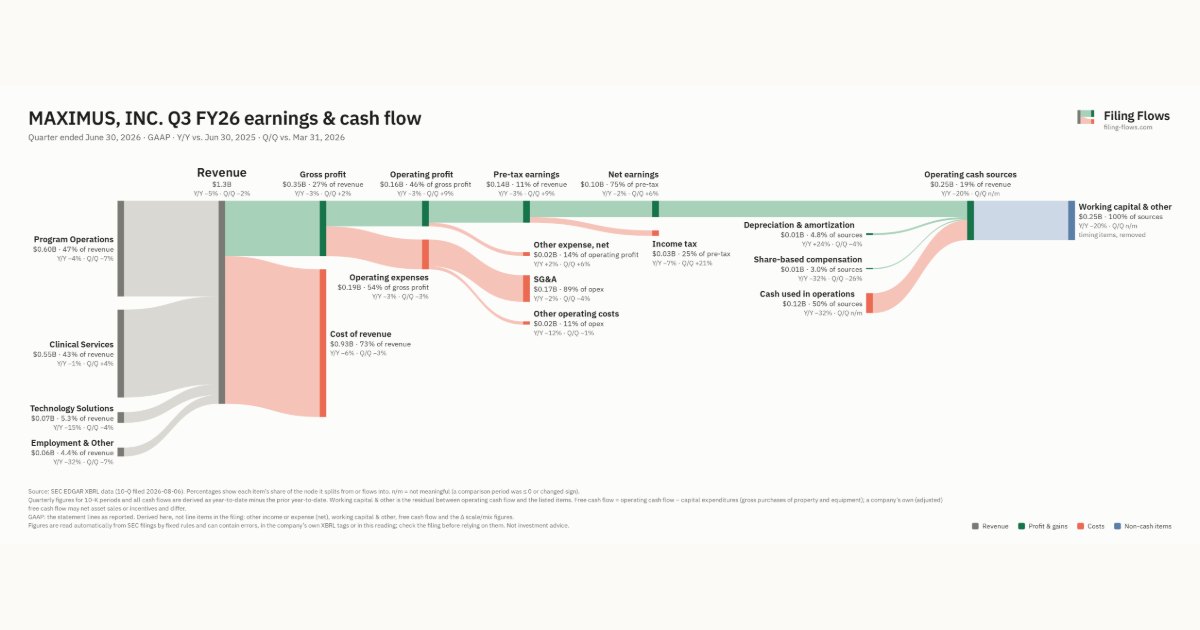
Maximus made $1.3B in Q3 FY26 (-5% Y/Y): Program Operations $603M, Clinical Services $553M, Technology Solutions $67.2M. Operating margin 12.6%, net earnings $104M. See where every dollar goes — costs, profit and cash — as a Sankey from the 10-Q filed Aug 6, 2026.
Drawing the Sankey…
Open the interactive Sankey → click any line for what the company wrote about it, compare Y/Y and Q/Q, export as PNG or PDF
What changed this quarter
Revenue was $1.3B in Q3 FY26, down 5% year over year and down 2% from the previous quarter. Program Operations was the largest line at 47% of revenue. Employment & Other lost $0.03B year over year (down 32%), 38% of the total change.
Gross margin was 27.3%, up 0.6 points from Q3 FY25. Operating profit was $0.16B, a 12.6% margin (up 0.3 points year over year). Operating expenses fell 3% while revenue fell 5%. Net earnings were $0.10B, down 2% year over year. The effective tax rate was 25.0%.
Operating cash flow was −$0.12B. Non-cash charges added back $0.01B of depreciation and amortization and $0.01B of share-based compensation. Working capital and other items used $0.25B. Capital expenditures of $0.01B exceeded it, leaving free cash flow of −$0.14B.
Quarterly history
| Quarter | Form | Filed | Revenue | Y/Y | Op. margin | Net earnings | Op. cash flow |
|---|---|---|---|---|---|---|---|
| Q3 FY26 | 10-Q | Aug 6, 2026 | $1.3B | -5% | 12.6% | $104M | −$125M |
| Q2 FY26 | 10-Q | May 7, 2026 | $1.3B | -4% | 11.4% | $98.1M | $190M |
| Q1 FY26 | 10-Q | Feb 5, 2026 | $1.3B | -4% | 10.9% | $93.9M | −$244M |
| Q4 FY25 | 10-K | Nov 20, 2025 | $1.3B | +0.2% | 9.3% | $75.3M | $649M |
| Q3 FY25 | 10-Q | Aug 7, 2025 | $1.3B | +2% | 12.3% | $106M | −$183M |
| Q2 FY25 | 10-Q | May 8, 2025 | $1.4B | +1% | 11.2% | $96.6M | $42.7M |
| Q4 FY24 | 10-K | Nov 21, 2024 | $1.3B | +4% | 8.5% | $72.5M | $164M |
Charts
Interactive views
The same charts as the app — open one to draw it.
💵Where each $1 goesinteractive
Loading the interactive chart…
🌏Named in Asian annual reportsinteractive
Loading the interactive chart…
🔄Rotation against the market and its industry (RRG)interactive
Loading the interactive chart…
🔍Earnings qualityinteractive
Loading the interactive chart…
⚖️Fair value by methodinteractive
Loading the interactive chart…
🔭Outlook & guidanceinteractive
Loading the interactive chart…
📈Investments: gains and what it boughtinteractive
Loading the interactive chart…
🏭Its industry’s money flow (input-output)interactive
Loading the interactive chart…
Customers and suppliers named in filings
Sells to
- U.S. government — 55% of its revenue · Stated in 10-K (sentence) · source
About Maximus
Maximus, a Virginia corporation established in 1975 and celebrating its 50th anniversary this year, is a leading provider of tech-enabled services to government agencies. By moving people, technology, and government forward, Maximus helps improve the delivery of public services for more than 100 million American citizens, as well as citizens in the U.K., Canada, and the Middle East, amid complex technological, health, economic, and social challenges. As a trusted and accountable partner to primarily U.S. federal and state customers, we proudly design, develop, and deliver innovative and efficient programs that improve government’s effectiveness in serving its citizens.
In its own words, from its 10-K, filed Nov 20, 2025.
Maximus against its Services-Business Services, NEC peers
The largest companies of the same SEC industry, each at its latest quarter. Revenue growth: -5% against the peers' median +10%. Operating margin: 12.6% against the peers' median 12.6%.
| Company | Quarter | Revenue | Y/Y | Op. margin |
|---|---|---|---|---|
| MMS Maximus | Q3 FY26 | $1.3B | -5% | 12.6% |
| ACN Accenture | Q4 FY26 | $18.7B | +6% | 15.3% |
| UBER Uber Technologies | Q3 2026 | $14.8B | +10% | 9.8% |
| V Visa | Q4 FY26 | $12.1B | +13% | 59.8% |
| MELI MercadoLibre | Q3 2026 | $10.8B | +45% | 6.3% |
| MA Mastercard | Q3 2026 | $9.8B | +14% | 59.8% |
| PYPL PayPal Holdings | Q3 2026 | $8.6B | +2% | 16.3% |
| FISV Fiserv | Q3 2026 | $5.2B | -1% | -105.7% |
| DASH DoorDash | Q3 2026 | $4.6B | +34% | 9.6% |
Source: Maximus 10-Q on SEC EDGAR · CIK 1032220 · Services-Business Services, NEC
13F: who owns MMS and who is buying
More on MMS
History
Every quarter: Q3 FY26 results · Q2 FY26 results · Q1 FY26 results · Q4 FY25 results · Q3 FY25 results · Q2 FY25 results · Q4 FY24 results
- Maximus gross margin by quarter
- Maximus operating margin by quarter
- Maximus net income by quarter
- Maximus free cash flow by quarter
- Maximus capital expenditures by quarter
- Maximus Program Operations revenue by quarter
- Maximus Clinical Services revenue by quarter
- Maximus Technology Solutions revenue by quarter