Filing Flows › Technology › Cloudflare (NET)
Cloudflare (NET) earnings and revenue breakdown
Latest: Q3 2026 · 10-Q filed Nov 5, 2026 · Cloudflare (NET) Q3 2026 earnings results →
Q3 2026 Revenue up 39% year over year to $783M · 4¢ of every $1 of revenue lost · operating margin -8.7%
Cloudflare made $783M in Q3 2026 (+39% Y/Y). Operating margin -8.7%, net loss $34.1M. See where every dollar goes — costs, profit and cash — as a Sankey from the 10-Q filed Nov 5, 2026.
Drawing the Sankey…
Open the interactive Sankey → click any line for what the company wrote about it, compare Y/Y and Q/Q, export as PNG or PDF
What changed this quarter
Revenue was $782.5M in Q3 2026, up 39% year over year and up 12% from the previous quarter.
Gross margin was 71.2%, down 2.8 points from Q3 2025. Operating costs exceeded revenue by $67.9M, an operating margin of -8.7%. Operating expenses grew 38% against revenue growth of 39%. The fastest-growing cost line was Sales & marketing (+43%). The quarter ended with a net loss of $34.1M, narrower than the previous quarter's $170.0M loss. Non-operating items added $40.6M, -149% of pre-tax earnings, so the bottom line overstates operating performance.
Operating cash flow was $215.4M (up 29% year over year). Non-cash charges added back $67.4M of depreciation and amortization and $167.6M of share-based compensation. Working capital and other items added $14.4M. After purchases of property and equipment ($121.8M) and capitalized internal-use software ($11.5M), free cash flow as the company reports it was $82.1M.
Quarterly history
| Quarter | Form | Filed | Revenue | Y/Y | Op. margin | Net earnings | Op. cash flow |
|---|---|---|---|---|---|---|---|
| Q3 2026 | 10-Q | Nov 5, 2026 | $783M | +39% | -8.7% | −$34.1M | $215M |
| Q2 2026 | 10-Q | Aug 6, 2026 | $696M | +36% | -29.6% | −$170M | $118M |
| Q1 2026 | 10-Q | May 8, 2026 | $640M | +34% | -9.7% | −$22.9M | $158M |
| Q4 2025 | 10-K | Feb 26, 2026 | $615M | +34% | -8.0% | −$12.1M | $190M |
| Q3 2025 | 10-Q | Oct 30, 2025 | $562M | +31% | -6.7% | −$1.3M | $167M |
| Q2 2025 | 10-Q | Jul 31, 2025 | $512M | +28% | -13.1% | −$50.4M | $99.8M |
| Q1 2025 | 10-Q | May 8, 2025 | $479M | +26% | -11.1% | −$38.5M | $146M |
Charts
In supply chains and themes
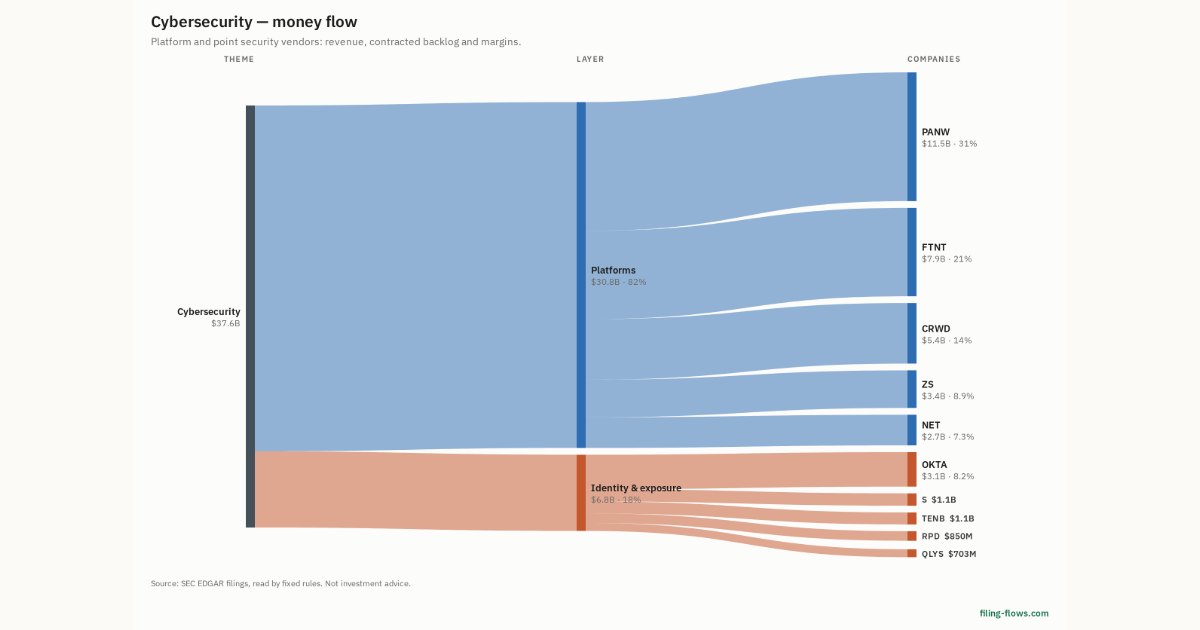
Interactive views
The same charts as the app — open one to draw it.
💵Where each $1 goesinteractive
Loading the interactive chart…
🌏Named in Asian annual reportsinteractive
Loading the interactive chart…
🔄Rotation against the market and its industry (RRG)interactive
Loading the interactive chart…
🔍Earnings qualityinteractive
Loading the interactive chart…
⚖️Fair value by methodinteractive
Loading the interactive chart…
🔭Outlook & guidanceinteractive
Loading the interactive chart…
📈Investments: gains and what it boughtinteractive
Loading the interactive chart…
🏭Its industry’s money flow (input-output)interactive
Loading the interactive chart…
About Cloudflare
Over the past decade, the technology industry has been undergoing a massive transition from on-premises hardware and software that customers buy, to services in the cloud that they rent. Organizations find themselves at different points in this transition to the cloud. Regardless of where organizations are in their transition, they all face a common set of challenges: they exist in a complex, heterogeneous infrastructure environment which exacerbates the fundamental problems of the Internet more than ever, and the on-premises hardware boxes that they once relied upon to solve these problems were never designed to work in such an environment. As more workloads move to the cloud and workforces become increasingly distributed globally, there is no point in installing additional hardware boxes on premise. An on-premises box will not solve the problems organizations now face.
In its own words, from its 10-K, filed Feb 26, 2026.
Cloudflare against its Services-Prepackaged Software peers
The largest companies of the same SEC industry, each at its latest quarter. Revenue growth: +39% against the peers' median +19%. Operating margin: -8.7% against the peers' median 15.2%.
| Company | Quarter | Revenue | Y/Y | Op. margin |
|---|---|---|---|---|
| NET Cloudflare | Q3 2026 | $783M | +39% | -8.7% |
| MSFT Microsoft | Q1 FY27 | $92.3B | +19% | 49.8% |
| ORCL Oracle | Q1 FY27 | $19.3B | +30% | 34.8% |
| CRM Salesforce | Q2 FY27 | $11.3B | +11% | 20.5% |
| ADBE Adobe | Q3 FY26 | $6.8B | +13% | 34.8% |
| XYZ Block | Q3 2026 | $6.7B | +10% | 6.4% |
| INTU Intuit | Q4 FY26 | $4.4B | +14% | 10.9% |
| NOW ServiceNow | Q3 2026 | $4.1B | +20% | 9.4% |
| SHOP Shopify | Q3 2026 | $3.7B | +32% | 15.2% |
Source: Cloudflare 10-Q on SEC EDGAR · CIK 1477333 · Services-Prepackaged Software
Guidance and outlook
13F: who owns NET and who is buying
More on NET
History
Every quarter: Q3 2026 results · Q2 2026 results · Q1 2026 results · Q4 2025 results · Q3 2025 results · Q2 2025 results · Q1 2025 results