Filing Flows › Technology › Palo Alto Networks (PANW)
Palo Alto Networks (PANW) earnings and revenue breakdown
Latest: Q4 FY26 · 10-K filed Sep 10, 2026 · Palo Alto Networks (PANW) Q4 FY26 earnings results →
Q4 FY26 Revenue up 34% year over year to $3.4B · 8¢ of every $1 of revenue lost · operating margin 5.0%
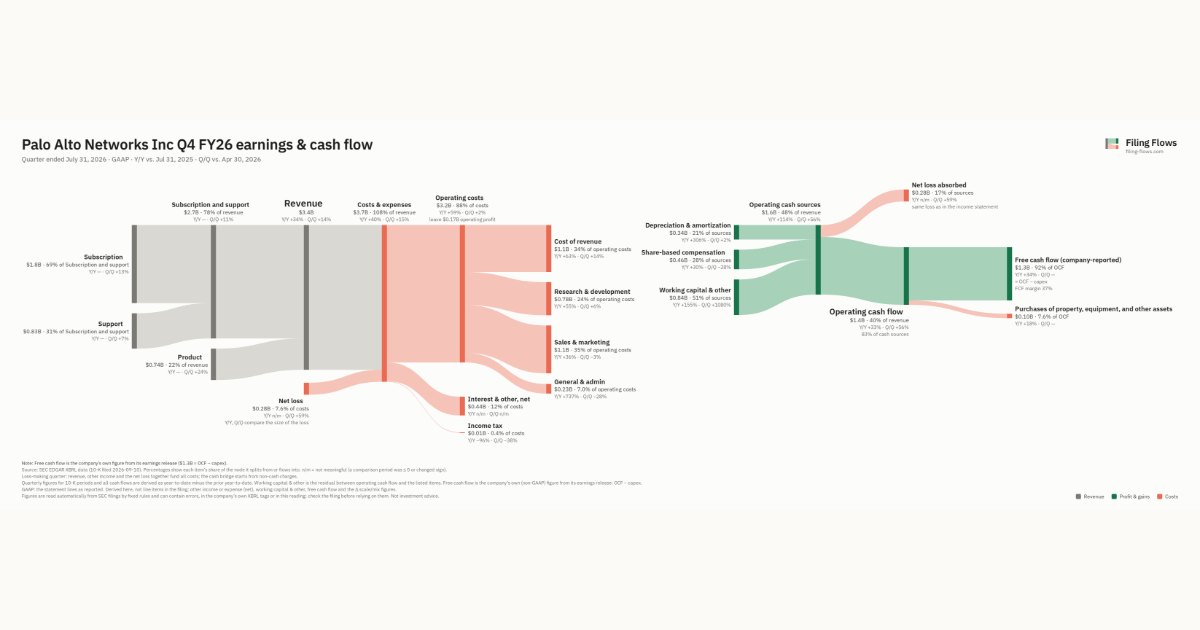
Palo Alto Networks made $3.4B in Q4 FY26 (+34% Y/Y): Subscription and support $2.7B, Product $738M. Operating margin 5.0%, net loss $282M. See where every dollar goes — costs, profit and cash — as a Sankey from the 10-K filed Sep 10, 2026.
Drawing the Sankey…
Open the interactive Sankey → click any line for what the company wrote about it, compare Y/Y and Q/Q, export as PNG or PDF
What changed this quarter
Revenue was $3.4B in Q4 FY26, up 34% year over year and up 14% from the previous quarter. Subscription was the largest line at 54% of revenue.
Gross margin was 67.6%, down 5.7 points from Q4 FY25. Operating profit was $0.17B, a 5.0% margin (down 14.6 points year over year). Operating profit fell $0.33B even though revenue rose $0.87B versus Q4 FY25, so costs grew faster than sales. Operating expenses grew 57% against revenue growth of 34%. The fastest-growing cost line was General & admin (+737%). The quarter ended with a net loss of $0.28B, wider than the previous quarter's $0.18B loss. Net interest and other expense of $0.44B was the main reason.
Operating cash flow was $1.4B (up 33% year over year). Non-cash charges added back $0.34B of depreciation and amortization and $0.46B of share-based compensation. Working capital and other items added $0.84B. After purchases of property, equipment, and other assets ($0.10B), free cash flow as the company reports it was $1.3B.
Quarterly history
| Quarter | Form | Filed | Revenue | Y/Y | Op. margin | Net earnings | Op. cash flow |
|---|---|---|---|---|---|---|---|
| Q4 FY26 | 10-K | Sep 10, 2026 | $3.4B | +34% | 5.0% | −$282M | $1.4B |
| Q3 FY26 | 10-Q | Jun 3, 2026 | $3.0B | +31% | -6.1% | −$177M | $871M |
| Q2 FY26 | 10-Q | Feb 18, 2026 | $2.6B | +15% | 15.3% | $432M | $554M |
| Q1 FY26 | 10-Q | Nov 20, 2025 | $2.5B | +16% | 12.5% | $334M | $1.8B |
| Q4 FY25 | 10-K | Aug 29, 2025 | $2.5B | +16% | 19.6% | $254M | $1.0B |
| Q3 FY25 | 10-Q | May 21, 2025 | $2.3B | +15% | 9.6% | $262M | $628M |
| Q2 FY25 | 10-Q | Feb 14, 2025 | $2.3B | +14% | 10.7% | $267M | $557M |
Charts
In supply chains and themes
Interactive views
The same charts as the app — open one to draw it.
💵Where each $1 goesinteractive
Loading the interactive chart…
🌏Named in Asian annual reportsinteractive
Loading the interactive chart…
🔄Rotation against the market and its industry (RRG)interactive
Loading the interactive chart…
🔍Earnings qualityinteractive
Loading the interactive chart…
⚖️Fair value by methodinteractive
Loading the interactive chart…
🔭Outlook & guidanceinteractive
Loading the interactive chart…
📈Investments: gains and what it boughtinteractive
Loading the interactive chart…
🏭Its industry’s money flow (input-output)interactive
Loading the interactive chart…
About Palo Alto Networks
Palo Alto Networks, Inc. is a global artificial intelligence (“AI”) cybersecurity provider and our vision is a world where each day is safer and more secure than the one before. We were incorporated in 2005 and are headquartered in Santa Clara, California. Our mission is to be the cybersecurity partner of choice, protecting our digital way of life. Our platforms and services help secure enterprise users, networks, clouds, endpoints, AI apps and agents, and identities by delivering comprehensive cybersecurity backed by AI and automation, and provide real-time visibility and monitoring across cloud infrastructure, applications and AI workloads. A key element of our strategy is to help our customers simplify their security architectures through consolidating disparate point products.
In its own words, from its 10-K, filed Sep 10, 2026.
Palo Alto Networks against its Computer Peripheral Equipment, NEC peers
The largest companies of the same SEC industry, each at its latest quarter. Revenue growth: +34% against the peers' median +13%. Operating margin: 5.0% against the peers' median 5.0%.
| Company | Quarter | Revenue | Y/Y | Op. margin |
|---|---|---|---|---|
| PANW Palo Alto Networks | Q4 FY26 | $3.4B | +34% | 5.0% |
| FTNT Fortinet | Q3 2026 | $2.1B | +20% | 33.9% |
| XRX Xerox Holdings | Q3 2026 | $1.9B | -5% | -53.9% |
| LOGI Logitech International S.A. | Q2 FY27 | $1.2B | +3% | 16.5% |
| CRSR Corsair Gaming | Q3 2026 | $367M | +6% | -0.4% |
| IMMR Immersion | Q1 FY27 | $294M | +0.8% | -6.8% |
| MITK Mitek Systems | Q3 FY26 | $54.0M | +18% | 21.4% |
| EVLV Evolv Technologies Holdings | Q2 2026 | $43.8M | +34% | -24.1% |
| WETH Wetouch Technology | Q2 2026 | $14.0M | +13% | 22.6% |
Source: Palo Alto Networks 10-K on SEC EDGAR · CIK 1327567 · Computer Peripheral Equipment, NEC
Guidance and outlook
13F: who owns PANW and who is buying
More on PANW
- How Palo Alto Networks makes money: revenue by segment
- Palo Alto Networks next earnings date and what analysts expect
- Palo Alto Networks stock forecast, price target and fair value
- Who owns Palo Alto Networks stock: holders, funds and Congress trades
- Is Palo Alto Networks a takeover target? LBO and rumors
- Palo Alto Networks recalls, complaints and regulation
History
Every quarter: Q4 FY26 results · Q3 FY26 results · Q2 FY26 results · Q1 FY26 results · Q4 FY25 results · Q3 FY25 results · Q2 FY25 results
- Palo Alto Networks guidance history: guided vs reported
- Palo Alto Networks gross margin by quarter
- Palo Alto Networks operating margin by quarter
- Palo Alto Networks net income by quarter
- Palo Alto Networks free cash flow by quarter
- Palo Alto Networks R&D spending by quarter
- Palo Alto Networks capital expenditures by quarter
- Palo Alto Networks Subscription and support revenue by quarter
- Palo Alto Networks Product revenue by quarter