Filing Flows › Industrials › Performance Food Group (PFGC)
Performance Food Group (PFGC) earnings and revenue breakdown
Latest: Q1 FY27 · 10-Q filed Nov 4, 2026 · Performance Food Group (PFGC) Q1 FY27 earnings results →
Q1 FY27 Revenue up 6% year over year to $18.0B · 1¢ of every $1 of revenue kept as net profit · operating margin 1.5%
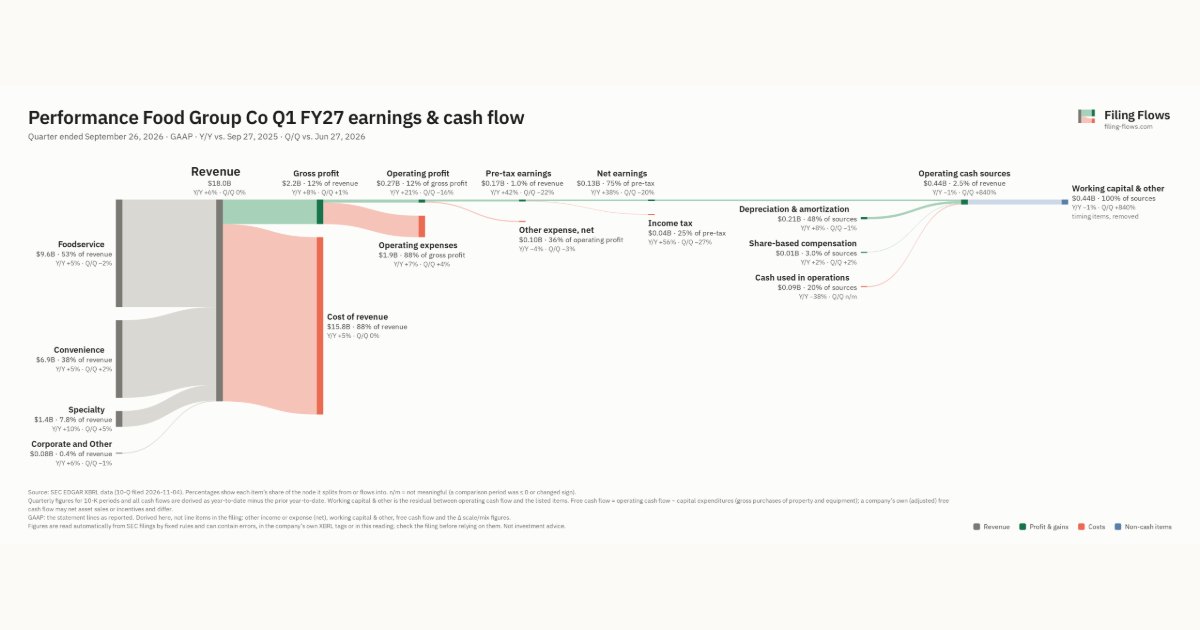
Performance Food Group made $18.0B in Q1 FY27 (+6% Y/Y): Foodservice $9.6B, Convenience $6.9B, Specialty $1.4B. Operating margin 1.5%, net earnings $130M. See where every dollar goes — costs, profit and cash — as a Sankey from the 10-Q filed Nov 4, 2026.
Drawing the Sankey…
Open the interactive Sankey → click any line for what the company wrote about it, compare Y/Y and Q/Q, export as PNG or PDF
What changed this quarter
Revenue was $18.0B in Q1 FY27, up 6% year over year and roughly flat from the previous quarter. Foodservice was the largest line at 53% of revenue. Foodservice added $0.46B year over year (up 5%), 49% of the total change.
Gross margin was 12.1%, up 0.3 points from Q1 FY26. Operating profit was $0.27B, a 1.5% margin (up 0.2 points year over year). Of the extra revenue versus Q1 FY26, 5% reached operating profit, above the 1% margin then. Operating expenses grew 7% against revenue growth of 6%. Net earnings were $0.13B, up 38% year over year. The effective tax rate was 25.2%.
Operating cash flow was −$0.09B. Non-cash charges added back $0.21B of depreciation and amortization and $0.01B of share-based compensation. Working capital and other items used $0.44B. Capital expenditures of $0.05B exceeded it, leaving free cash flow of −$0.14B.
Quarterly history
| Quarter | Form | Filed | Revenue | Y/Y | Op. margin | Net earnings | Op. cash flow |
|---|---|---|---|---|---|---|---|
| Q1 FY27 | 10-Q | Nov 4, 2026 | $18.0B | +6% | 1.5% | $130M | −$89.3M |
| Q4 FY26 | 10-K | Aug 12, 2026 | $18.0B | +6% | 1.8% | $162M | $342M |
| Q3 FY26 | 10-Q | May 6, 2026 | $16.3B | +6% | 0.9% | $41.7M | $616M |
| Q2 FY26 | 10-Q | Feb 4, 2026 | $16.4B | +5% | 1.2% | $61.7M | $601M |
| Q1 FY26 | 10-Q | Nov 5, 2025 | $17.1B | +11% | 1.3% | $93.6M | −$145M |
| Q4 FY25 | 10-K | Aug 13, 2025 | $16.9B | +12% | 1.6% | $132M | $383M |
| Q3 FY25 | 10-Q | May 7, 2025 | $15.3B | +10% | 1.1% | $58.3M | $448M |
Charts
Interactive views
The same charts as the app — open one to draw it.
💵Where each $1 goesinteractive
Loading the interactive chart…
🌏Named in Asian annual reportsinteractive
Loading the interactive chart…
🔄Rotation against the market and its industry (RRG)interactive
Loading the interactive chart…
🔍Earnings qualityinteractive
Loading the interactive chart…
⚖️Fair value by methodinteractive
Loading the interactive chart…
🔭Outlook & guidanceinteractive
Loading the interactive chart…
📈Investments: gains and what it boughtinteractive
Loading the interactive chart…
🏭Its industry’s money flow (input-output)interactive
Loading the interactive chart…
Customers and suppliers named in filings
Buys from
- MO — 22% of the supplier’s revenue · Stated in 10-K (sentence) · source
- Rreef Property Trust, Inc. — 15% of the supplier’s revenue · Stated in 10-K (XBRL) · source
About Performance Food Group
Performance Food Group is an industry leader and one of the largest food and foodservice distribution companies in North America with more than 150 locations. Founded and headquartered in Richmond, Virginia, PFG and our family of companies market and deliver quality food and food-related products to over 350,000 locations, including independent and chain restaurants, schools, business and industry locations, vending and office coffee service distributors, retailers, convenience stores, and theaters, and direct to consumers. PFG’s success as a Fortune 100 company is achieved through our over 44,000 dedicated associates committed to building strong relationships with the valued customers, suppliers and communities we serve. To learn more about PFG, visit pfgc.com.
In its own words, from its 8-K, filed Aug 12, 2026.
Performance Food Group against its Wholesale-Groceries, General Line peers
The largest companies of the same SEC industry, each at its latest quarter. Revenue growth: +6% against the peers' median +11%. Operating margin: 1.5% against the peers' median 1.5%.
| Company | Quarter | Revenue | Y/Y | Op. margin |
|---|---|---|---|---|
| PFGC Performance Food Group | Q1 FY27 | $18.0B | +6% | 1.5% |
| UNFI United Natural Foods | Q4 FY26 | $7.6B | -0.7% | 0.9% |
| CHEF Chefs' Warehouse | Q3 2026 | $1.1B | +11% | 4.5% |
| DIT Amcon Distributing | Q3 FY26 | $835M | +13% | 0.7% |
| IVFH Innovative Food Holdings | Q2 2026 | $13.1M | -22% | 3.0% |
| MWYN Marwynn Holdings | Q1 FY27 | $1.1M | 26× | -7.7% |
Source: Performance Food Group 10-Q on SEC EDGAR · CIK 1618673 · Wholesale-Groceries, General Line
Guidance and outlook
13F: who owns PFGC and who is buying
More on PFGC
- How Performance Food Group makes money: revenue by segment
- Performance Food Group next earnings date and what analysts expect
- Performance Food Group stock forecast, price target and fair value
- Who owns Performance Food Group stock: holders, funds and Congress trades
- Performance Food Group guidance and outlook
- Is Performance Food Group a takeover target? LBO and rumors
- Performance Food Group recalls, complaints and regulation
History
Every quarter: Q1 FY27 results · Q4 FY26 results · Q3 FY26 results · Q2 FY26 results · Q1 FY26 results · Q4 FY25 results · Q3 FY25 results
- Performance Food Group guidance history: guided vs reported
- Performance Food Group gross margin by quarter
- Performance Food Group operating margin by quarter
- Performance Food Group net income by quarter
- Performance Food Group free cash flow by quarter
- Performance Food Group capital expenditures by quarter
- Performance Food Group Foodservice revenue by quarter
- Performance Food Group Convenience revenue by quarter
- Performance Food Group Specialty revenue by quarter