Filing Flows › Real Estate › Public Storage (PSA)
Public Storage (PSA) earnings and revenue breakdown
Latest: Q3 2026 · 10-Q filed Oct 26, 2026 · Public Storage (PSA) Q3 2026 earnings results →
Q3 2026 Revenue up 12% year over year to $1.4B · 27¢ of every $1 of revenue kept as net profit · operating margin 23.2%
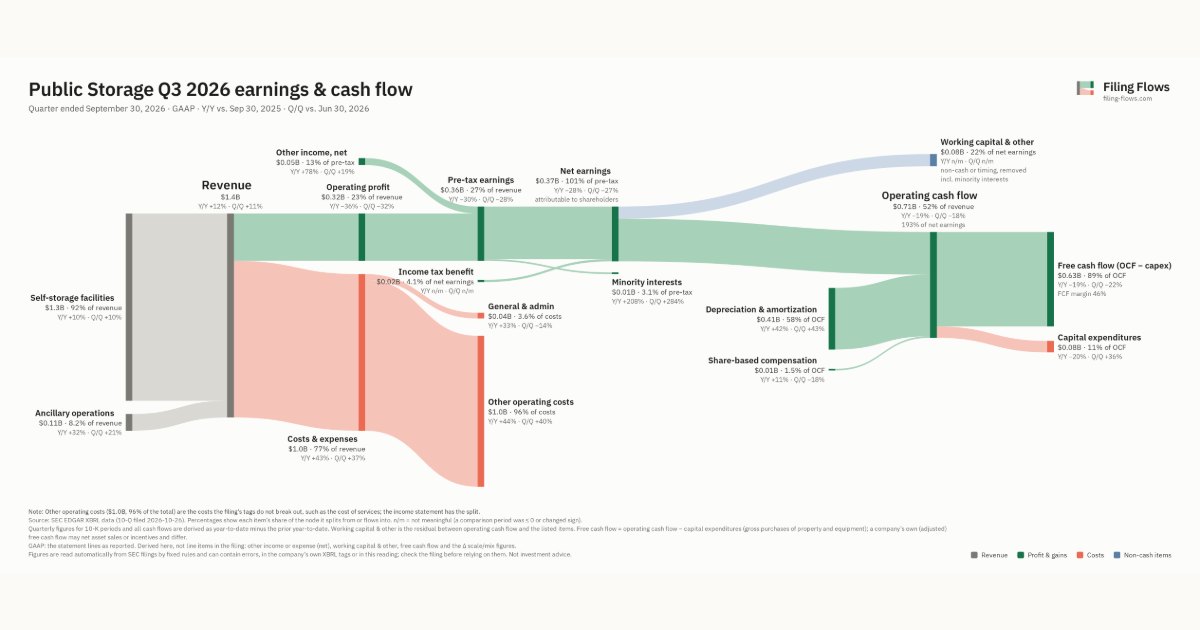
Public Storage made $1.4B in Q3 2026 (+12% Y/Y): Self-storage facilities $1.3B, Ancillary operations $112M. Operating margin 23.2%, net earnings $367M. See where every dollar goes — costs, profit and cash — as a Sankey from the 10-Q filed Oct 26, 2026.
Drawing the Sankey…
Open the interactive Sankey → click any line for what the company wrote about it, compare Y/Y and Q/Q, export as PNG or PDF
What changed this quarter
Revenue was $1.4B in Q3 2026, up 12% year over year and up 11% from the previous quarter. Self-storage facilities was the largest line at 92% of revenue. Self-storage facilities added $0.12B year over year (up 10%), 81% of the total change.
Operating profit was $0.32B, a 23.2% margin (down 17.0 points year over year). Operating profit fell $0.17B even though revenue rose $0.14B versus Q3 2025, so costs grew faster than sales. Total costs grew 43% against revenue growth of 12%. The fastest-growing cost line was Other operating costs (+44%). Net earnings were $0.37B, down 28% year over year. The effective tax rate was -4.1%.
Operating cash flow was $0.71B (down 19% year over year), 187% of net income including minority interests. Non-cash charges added back $0.41B of depreciation and amortization and $0.01B of share-based compensation. Working capital and other items used $0.09B. Capital expenditures of $0.08B left free cash flow of $0.63B.
Quarterly history
| Quarter | Form | Filed | Revenue | Y/Y | Op. margin | Net earnings | Op. cash flow |
|---|---|---|---|---|---|---|---|
| Q3 2026 | 10-Q | Oct 26, 2026 | $1.4B | +12% | 23.2% | $367M | $709M |
| Q2 2026 | 10-Q | Jul 29, 2026 | $1.2B | +3% | 37.9% | $500M | $868M |
| Q1 2026 | 10-Q | Apr 27, 2026 | $1.2B | +3% | 38.9% | $526M | $695M |
| Q4 2025 | 10-K | Feb 12, 2026 | $1.2B | +3% | 39.2% | $507M | $734M |
| Q3 2025 | 10-Q | Oct 29, 2025 | $1.2B | +3% | 40.2% | $511M | $875M |
| Q2 2025 | 10-Q | Jul 30, 2025 | $1.2B | +2% | 41.6% | $358M | $873M |
| Q1 2025 | 10-Q | Apr 30, 2025 | $1.2B | +2% | 39.2% | $408M | $705M |
Charts
Interactive views
The same charts as the app — open one to draw it.
💵Where each $1 goesinteractive
Loading the interactive chart…
🌏Named in Asian annual reportsinteractive
Loading the interactive chart…
🔄Rotation against the market and its industry (RRG)interactive
Loading the interactive chart…
🔍Earnings qualityinteractive
Loading the interactive chart…
⚖️Fair value by methodinteractive
Loading the interactive chart…
🔭Outlook & guidanceinteractive
Loading the interactive chart…
📈Investments: gains and what it boughtinteractive
Loading the interactive chart…
🏭Its industry’s money flow (input-output)interactive
Loading the interactive chart…
About Public Storage
This Annual Report on Form 10-K contains forward-looking statements within the meaning of the Private Securities Litigation Reform Act of 1995. Forward-looking statements include statements relating to our 2026 guidance and all underlying assumptions, our expected acquisition, disposition, development, and redevelopment activity, supply and demand for our self-storage facilities, information relating to operating trends in our markets, expectations regarding operating expenses, including property tax changes, expectations regarding the impacts from inflation and changes in macroeconomic conditions, our strategic priorities, expectations with respect to financing activities, rental rates, zoning, cap rates, and yields, leasing expectations, our credit ratings, and all other statements other than statements of historical fact.
In its own words, from its 10-K, filed Feb 12, 2026.
Public Storage against its Real Estate Investment Trusts peers
The largest companies of the same SEC industry, each at its latest quarter. Revenue growth: +12% against the peers' median +12%. Operating margin: 23.2% against the peers' median 20.6%.
| Company | Quarter | Revenue | Y/Y | Op. margin |
|---|---|---|---|---|
| PSA Public Storage | Q3 2026 | $1.4B | +12% | 23.2% |
| WELL Welltower | Q3 2026 | $3.7B | +38% | 9.1% |
| AMT American Tower | Q3 2026 | $2.8B | +2% | 45.6% |
| EQIX Equinix | Q3 2026 | $2.6B | +11% | 23.3% |
| PLD Prologis | Q1 2026 | $2.3B | +7% | 52.7% |
| IRM Iron Mountain | Q3 2026 | $2.0B | +14% | 20.6% |
| DLR Digital Realty Trust | Q3 2026 | $1.9B | +21% | 15.9% |
| WY Weyerhaeuser | Q3 2026 | $1.9B | +8% | 5.4% |
| VTR Ventas | Q3 2026 | $1.8B | +23% | 2.9% |
Source: Public Storage 10-Q on SEC EDGAR · CIK 1393311 · Real Estate Investment Trusts
13F: who owns PSA and who is buying
More on PSA
History
Every quarter: Q3 2026 results · Q2 2026 results · Q1 2026 results · Q4 2025 results · Q3 2025 results · Q2 2025 results · Q1 2025 results
- Public Storage guidance history: guided vs reported
- Public Storage operating margin by quarter
- Public Storage net income by quarter
- Public Storage free cash flow by quarter
- Public Storage capital expenditures by quarter
- Public Storage Self-storage facilities revenue by quarter
- Public Storage Ancillary operations revenue by quarter