Filing Flows › Technology › Tenable Holdings (TENB)
Tenable Holdings (TENB) earnings and revenue breakdown
Latest: Q3 2026 · 10-Q filed Nov 3, 2026 · Tenable Holdings (TENB) Q3 2026 earnings results →
Q3 2026 Revenue up 10% year over year to $276M · 4¢ of every $1 of revenue kept as net profit · operating margin 6.0%
Tenable Holdings made $276M in Q3 2026 (+10% Y/Y): Subscription revenue $255M, Professional services and other revenue $12.1M, Perpetual license and maintenance revenue $9.7M. Operating margin 6.0%, net earnings $11.3M. See where every dollar goes — costs, profit and cash — as a Sankey from the 10-Q filed Nov 3, 2026.
Drawing the Sankey…
Open the interactive Sankey → click any line for what the company wrote about it, compare Y/Y and Q/Q, export as PNG or PDF
What changed this quarter
Revenue was $276.4M in Q3 2026, up 9% year over year and up 3% from the previous quarter. Subscription revenue was the largest line at 92% of revenue. Subscription revenue added $22.4M year over year (up 10%), 93% of the total change. Perpetual license and maintenance revenue declined 12%.
Gross margin was 77.8%, up 0.3 points from Q3 2025. Operating profit was $16.7M, a 6.0% margin (up 3.2 points year over year). Of the extra revenue versus Q3 2025, 40% reached operating profit, above the 3% margin then. Operating expenses grew 5% against revenue growth of 9%. The fastest-growing cost line was Research & development (+10%). Net earnings were $11.3M, up 400% year over year. The effective tax rate was -5.0%.
Operating cash flow was $72.5M (up 35% year over year), 642% of net earnings. Non-cash charges added back $10.5M of depreciation and amortization and $51.2M of share-based compensation. After capitalized software development costs ($4.8M) and purchases of property and equipment ($3.5M), free cash flow as the company reports it was $64.2M.
Quarterly history
| Quarter | Form | Filed | Revenue | Y/Y | Op. margin | Net earnings | Op. cash flow |
|---|---|---|---|---|---|---|---|
| Q3 2026 | 10-Q | Nov 3, 2026 | $276M | +10% | 6.0% | $11.3M | $72.5M |
| Q2 2026 | 10-Q | Aug 4, 2026 | $269M | +9% | 4.6% | $3.8M | $44.7M |
| Q1 2026 | 10-Q | May 5, 2026 | $262M | +10% | 3.3% | $1.4M | $88.0M |
| Q4 2025 | 10-K | Feb 27, 2026 | $261M | +10% | 3.4% | −$737K | $83.0M |
| Q3 2025 | 10-Q | Nov 4, 2025 | $252M | +11% | 2.8% | $2.3M | $53.9M |
| Q2 2025 | 10-Q | Aug 8, 2025 | $247M | +12% | -3.0% | −$14.7M | $42.5M |
| Q1 2025 | 10-Q | May 6, 2025 | $239M | +11% | -7.4% | −$22.9M | $87.4M |
Charts
In supply chains and themes
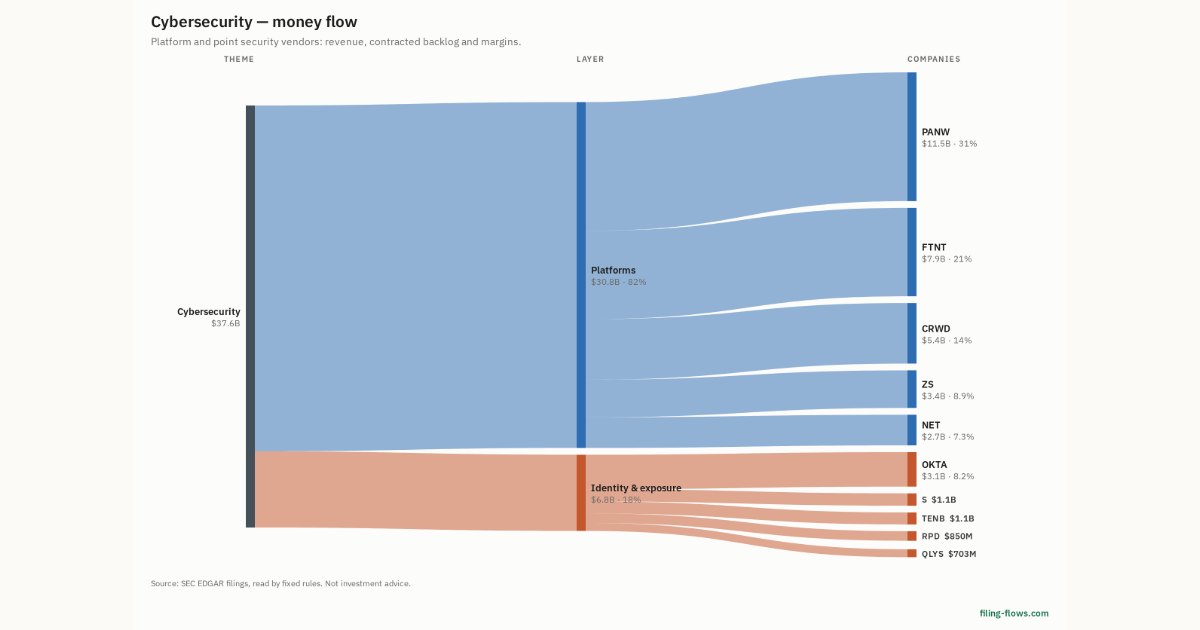
Interactive views
The same charts as the app — open one to draw it.
💵Where each $1 goesinteractive
Loading the interactive chart…
🌏Named in Asian annual reportsinteractive
Loading the interactive chart…
🔄Rotation against the market and its industry (RRG)interactive
Loading the interactive chart…
🔍Earnings qualityinteractive
Loading the interactive chart…
⚖️Fair value by methodinteractive
Loading the interactive chart…
🔭Outlook & guidanceinteractive
Loading the interactive chart…
📈Investments: gains and what it boughtinteractive
Loading the interactive chart…
🏭Its industry’s money flow (input-output)interactive
Loading the interactive chart…
Customers and suppliers named in filings
Sells to
About Tenable Holdings
Tenable is the leading provider of exposure management solutions. Exposure management is an increasingly critical category that extends foundational vulnerability management capabilities to advance risk assessment and prioritization across the entire attack surface – from IT infrastructure and cloud environments to critical infrastructure and artificial intelligence (AI). Tenable unifies security visibility, insight and action across this attack surface, equipping modern organizations to quickly identify and close the cybersecurity gaps that erode business value, reputation and trust.
In its own words, from its 10-K, filed Feb 27, 2026.
Tenable Holdings against its Services-Prepackaged Software peers
The largest companies of the same SEC industry, each at its latest quarter. Revenue growth: +10% against the peers' median +14%. Operating margin: 6.0% against the peers' median 15.2%.
| Company | Quarter | Revenue | Y/Y | Op. margin |
|---|---|---|---|---|
| TENB Tenable Holdings | Q3 2026 | $276M | +10% | 6.0% |
| MSFT Microsoft | Q1 FY27 | $92.3B | +19% | 49.8% |
| ORCL Oracle | Q1 FY27 | $19.3B | +30% | 34.8% |
| CRM Salesforce | Q2 FY27 | $11.3B | +11% | 20.5% |
| ADBE Adobe | Q3 FY26 | $6.8B | +13% | 34.8% |
| XYZ Block | Q3 2026 | $6.7B | +10% | 6.4% |
| INTU Intuit | Q4 FY26 | $4.4B | +14% | 10.9% |
| NOW ServiceNow | Q3 2026 | $4.1B | +20% | 9.4% |
| SHOP Shopify | Q3 2026 | $3.7B | +32% | 15.2% |
Source: Tenable Holdings 10-Q on SEC EDGAR · CIK 1660280 · Services-Prepackaged Software
Guidance and outlook
13F: who owns TENB and who is buying
More on TENB
- How Tenable Holdings makes money: revenue by segment
- Tenable Holdings next earnings date and what analysts expect
- Tenable Holdings stock forecast, price target and fair value
- Who owns Tenable Holdings stock: holders, funds and Congress trades
- Tenable Holdings guidance and outlook
- Is Tenable Holdings a takeover target? LBO and rumors
History
Every quarter: Q3 2026 results · Q2 2026 results · Q1 2026 results · Q4 2025 results · Q3 2025 results · Q2 2025 results · Q1 2025 results
- Tenable Holdings guidance history: guided vs reported
- Tenable Holdings gross margin by quarter
- Tenable Holdings operating margin by quarter
- Tenable Holdings net income by quarter
- Tenable Holdings free cash flow by quarter
- Tenable Holdings R&D spending by quarter
- Tenable Holdings Subscription revenue revenue by quarter
- Tenable Holdings Professional services and other revenue revenue by quarter
- Tenable Holdings Perpetual license and maintenance revenue revenue by quarter