Filing Flows › Consumer Discretionary › Autonation (AN)
Autonation (AN) earnings and revenue breakdown
Latest: Q3 2026 · 10-Q filed Oct 30, 2026 · Autonation (AN) Q3 2026 earnings results →
Q3 2026 Revenue down 0% year over year to $7.0B · 2¢ of every $1 of revenue kept as net profit · operating margin 4.5%
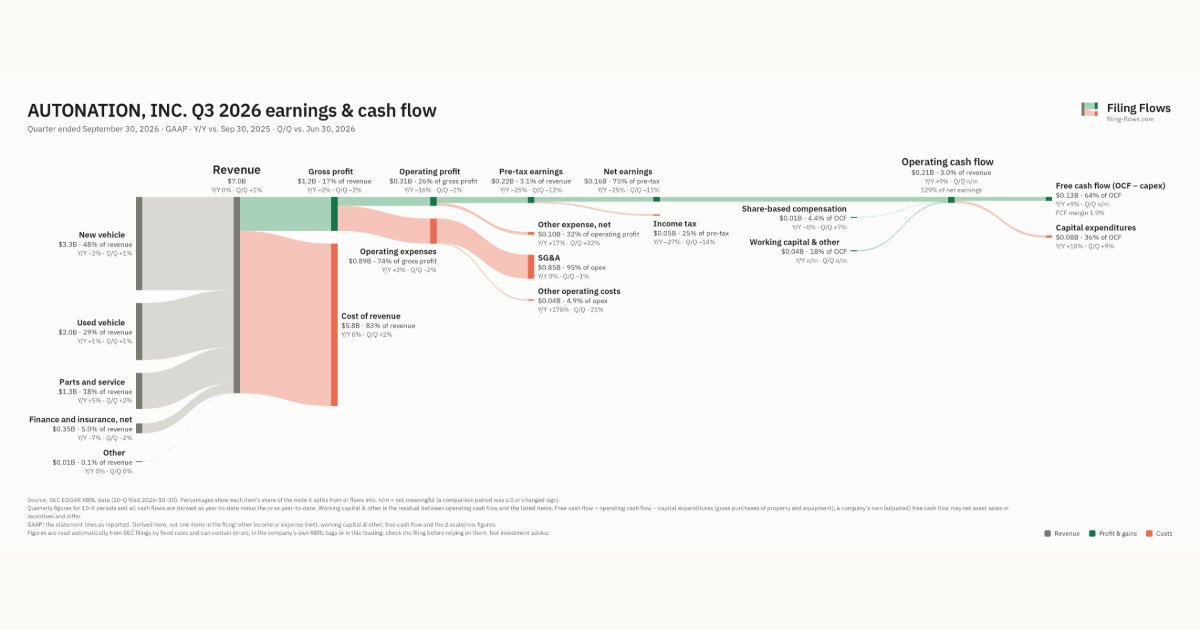
Autonation made $7.0B in Q3 2026 (-0.4% Y/Y): New vehicle $3.3B, Used vehicle $2.0B, Parts and service $1.3B. Operating margin 4.5%, net earnings $162M. See where every dollar goes — costs, profit and cash — as a Sankey from the 10-Q filed Oct 30, 2026.
Drawing the Sankey…
Open the interactive Sankey → click any line for what the company wrote about it, compare Y/Y and Q/Q, export as PNG or PDF
What changed this quarter
Revenue was $7.0B in Q3 2026, roughly flat year over year and up 1% from the previous quarter. New vehicle was the largest line at 48% of revenue. New vehicle lost $0.09B year over year (down 2%), 314% of the total change.
Gross margin was 17.2%, down 0.4 points from Q3 2025. Operating profit was $0.31B, a 4.5% margin (down 0.8 points year over year). Operating expenses grew 3% against flat revenue. The fastest-growing cost line was Other operating costs (+176%). Net earnings were $0.16B, down 25% year over year. The effective tax rate was 24.7%.
Operating cash flow was $0.21B (up 9% year over year), 129% of net earnings. Non-cash charges added back $0.01B of share-based compensation. Working capital and other items added $0.04B. Capital expenditures of $0.08B left free cash flow of $0.13B.
Quarterly history
| Quarter | Form | Filed | Revenue | Y/Y | Op. margin | Net earnings | Op. cash flow |
|---|---|---|---|---|---|---|---|
| Q3 2026 | 10-Q | Oct 30, 2026 | $7.0B | -0.4% | 4.5% | $162M | $209M |
| Q2 2026 | 10-Q | Jul 31, 2026 | $6.9B | -0.6% | 4.6% | $182M | −$71.1M |
| Q1 2026 | 10-Q | May 1, 2026 | $6.6B | -2% | 4.8% | $205M | $22.2M |
| Q4 2025 | 10-K | Feb 12, 2026 | $6.9B | -4% | 4.5% | $172M | $150M |
| Q3 2025 | 10-Q | Oct 23, 2025 | $7.0B | +7% | 5.3% | $215M | $192M |
| Q2 2025 | 10-Q | Jul 25, 2025 | $7.0B | +8% | 3.1% | $86.4M | −$178M |
| Q1 2025 | 10-Q | Apr 25, 2025 | $6.7B | +3% | 5.0% | $176M | −$52.5M |
Charts
Interactive views
The same charts as the app — open one to draw it.
💵Where each $1 goesinteractive
Loading the interactive chart…
🌏Named in Asian annual reportsinteractive
Loading the interactive chart…
🔄Rotation against the market and its industry (RRG)interactive
Loading the interactive chart…
🔍Earnings qualityinteractive
Loading the interactive chart…
⚖️Fair value by methodinteractive
Loading the interactive chart…
🔭Outlook & guidanceinteractive
Loading the interactive chart…
📈Investments: gains and what it boughtinteractive
Loading the interactive chart…
🏭Its industry’s money flow (input-output)interactive
Loading the interactive chart…
Customers and suppliers named in filings
Buys from
- F · Stated in 10-K (named, share not stated) · source
- GM · Stated in 10-K (named, share not stated) · source
About Autonation
AutoNation, Inc., through its subsidiaries, is one of the largest automotive retailers in the United States. As of December 31, 2025, we owned and operated 323 new vehicle franchises from 245 stores located in the United States, predominantly in major metropolitan markets in the Sunbelt region. Our stores, which we believe include some of the most recognizable and well-known in our key markets, sell 30 different new vehicle brands. The core brands of new vehicles that we sell, representing approximately 89% of the new vehicles that we sold in 2025, are manufactured by Toyota (including Lexus), Honda, Ford, General Motors, BMW, Mercedes-Benz, Stellantis, and Volkswagen (including Audi and Porsche).
In its own words, from its 10-K, filed Feb 12, 2026.
Autonation against its Retail-Auto Dealers & Gasoline Stations peers
The largest companies of the same SEC industry, each at its latest quarter. Revenue growth: -0.4% against the peers' median +4%. Operating margin: 4.5% against the peers' median 4.2%.
| Company | Quarter | Revenue | Y/Y | Op. margin |
|---|---|---|---|---|
| AN Autonation | Q3 2026 | $7.0B | -0.4% | 4.5% |
| LAD Lithia Motors | Q3 2026 | $9.9B | +3% | 4.2% |
| PAG Penske Automotive Group | Q3 2026 | $8.4B | +4% | 3.6% |
| CVNA Carvana | Q3 2026 | $8.0B | +42% | 8.9% |
| KMX CarMax | Q2 FY27 | $7.9B | +20% | 2.8% |
| MUSA Murphy USA | Q3 2026 | $6.9B | +35% | 3.8% |
| CASY Caseys General Stores | Q1 FY27 | $5.7B | +24% | 6.1% |
| GPI Group 1 Automotive | Q3 2026 | $5.4B | -7% | 3.7% |
| ABG Asbury Automotive Group | Q3 2026 | $4.4B | -8% | 4.7% |
Source: Autonation 10-Q on SEC EDGAR · CIK 350698 · Retail-Auto Dealers & Gasoline Stations
Guidance and outlook
13F: who owns AN and who is buying
More on AN
History
Every quarter: Q3 2026 results · Q2 2026 results · Q1 2026 results · Q4 2025 results · Q3 2025 results · Q2 2025 results · Q1 2025 results
- Autonation gross margin by quarter
- Autonation operating margin by quarter
- Autonation net income by quarter
- Autonation free cash flow by quarter
- Autonation capital expenditures by quarter
- Autonation New vehicle revenue by quarter
- Autonation Used vehicle revenue by quarter
- Autonation Parts and service revenue by quarter