Filing Flows › Consumer Discretionary › Group 1 Automotive (GPI)
Group 1 Automotive (GPI) earnings and revenue breakdown
Latest: Q3 2026 · 10-Q filed Oct 29, 2026 · Group 1 Automotive (GPI) Q3 2026 earnings results →
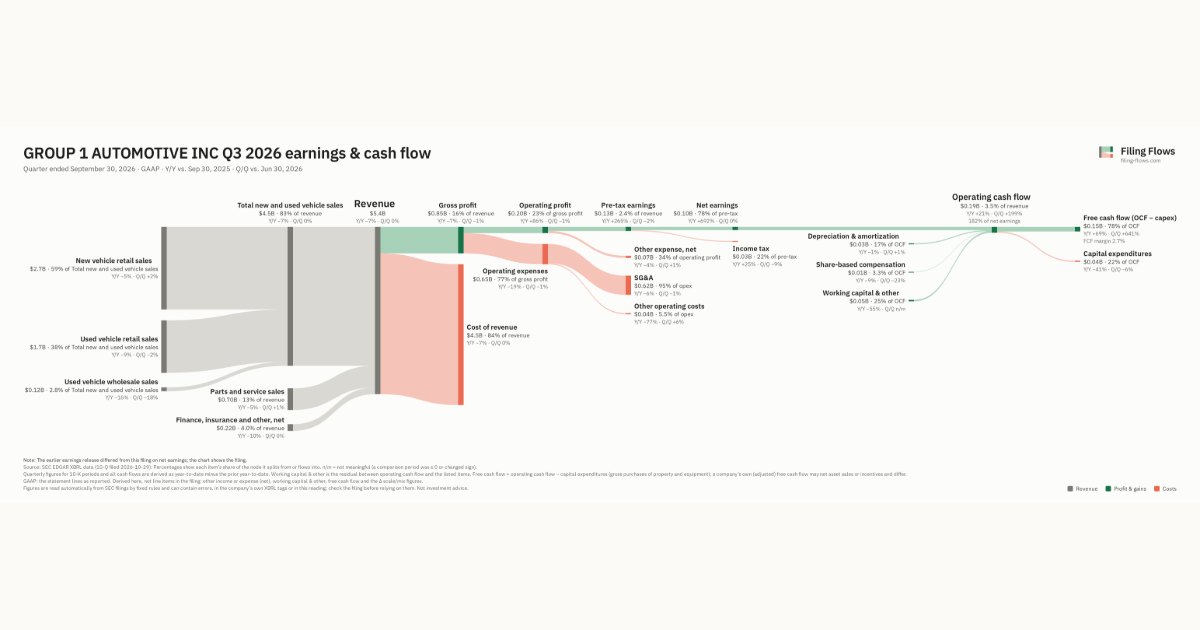
Q3 2026 Revenue down 7% year over year to $5.4B · 2¢ of every $1 of revenue kept as net profit · operating margin 3.7%
Group 1 Automotive made $5.4B in Q3 2026 (-7% Y/Y): Total new and used vehicle sales $4.5B, Parts and service sales $701M, Finance, insurance and other, net $216M. Operating margin 3.7%, net earnings $103M. See where every dollar goes — costs, profit and cash — as a Sankey from the 10-Q filed Oct 29, 2026.
Drawing the Sankey…
Open the interactive Sankey → click any line for what the company wrote about it, compare Y/Y and Q/Q, export as PNG or PDF
What changed this quarter
Revenue was $5.4B in Q3 2026, down 7% year over year and roughly flat from the previous quarter. New vehicle retail sales was the largest line at 49% of revenue. Used vehicle retail sales lost $0.16B year over year (down 9%), 42% of the total change.
Gross margin was 15.8%, down 0.1 points from Q3 2025. Operating profit was $0.20B, a 3.7% margin (up 1.9 points year over year). Operating expenses fell 19% while revenue fell 7%. Net earnings were $0.10B, up 692% year over year. The effective tax rate was 21.8%.
Operating cash flow was $0.19B (up 21% year over year), 182% of net earnings. Non-cash charges added back $0.03B of depreciation and amortization and $0.01B of share-based compensation. Working capital and other items added $0.05B. Capital expenditures of $0.04B left free cash flow of $0.15B.
Quarterly history
| Quarter | Form | Filed | Revenue | Y/Y | Op. margin | Net earnings | Op. cash flow |
|---|---|---|---|---|---|---|---|
| Q3 2026 | 10-Q | Oct 29, 2026 | $5.4B | -7% | 3.7% | $103M | $187M |
| Q2 2026 | 10-Q | Jul 30, 2026 | $5.4B | -6% | 3.8% | $103M | $62.6M |
| Q1 2026 | 10-Q | Apr 30, 2026 | $5.4B | -2% | 4.5% | $130M | $92.4M |
| Q4 2025 | 10-K | Feb 13, 2026 | $5.6B | +0.6% | 2.5% | $43.6M | $129M |
| Q3 2025 | 10-Q | Oct 28, 2025 | $5.8B | +11% | 1.9% | $13.0M | $155M |
| Q2 2025 | 10-Q | Jul 24, 2025 | $5.7B | +21% | 4.4% | $140M | $252M |
| Q1 2025 | 10-Q | Apr 25, 2025 | $5.5B | +23% | 4.2% | $128M | $159M |
Charts
Interactive views
The same charts as the app — open one to draw it.
💵Where each $1 goesinteractive
Loading the interactive chart…
🌏Named in Asian annual reportsinteractive
Loading the interactive chart…
🔄Rotation against the market and its industry (RRG)interactive
Loading the interactive chart…
🔍Earnings qualityinteractive
Loading the interactive chart…
⚖️Fair value by methodinteractive
Loading the interactive chart…
🔭Outlook & guidanceinteractive
Loading the interactive chart…
📈Investments: gains and what it boughtinteractive
Loading the interactive chart…
🏭Its industry’s money flow (input-output)interactive
Loading the interactive chart…
About Group 1 Automotive
Group 1 Automotive, Inc. is a leading operator in the automotive retail industry. We sell and/or lease new and used cars and light trucks; arrange related vehicle financing; sell service and insurance contracts; provide automotive maintenance and repair services; and sell vehicle parts retail and wholesale. We have operations in geographically diverse markets that extend across 17 states in the U.S. and 62 towns and cities in the U.K. As of December 31, 2025, our retail network consists of 145 dealerships and 21 collision centers in the U.S. and 109 dealerships and 11 collision centers in the U.K.
In its own words, from its 10-K, filed Feb 13, 2026.
Group 1 Automotive against its Retail-Auto Dealers & Gasoline Stations peers
The largest companies of the same SEC industry, each at its latest quarter. Revenue growth: -7% against the peers' median +4%. Operating margin: 3.7% against the peers' median 4.2%.
| Company | Quarter | Revenue | Y/Y | Op. margin |
|---|---|---|---|---|
| GPI Group 1 Automotive | Q3 2026 | $5.4B | -7% | 3.7% |
| LAD Lithia Motors | Q3 2026 | $9.9B | +3% | 4.2% |
| PAG Penske Automotive Group | Q3 2026 | $8.4B | +4% | 3.6% |
| CVNA Carvana | Q3 2026 | $8.0B | +42% | 8.9% |
| KMX CarMax | Q2 FY27 | $7.9B | +20% | 2.8% |
| AN Autonation | Q3 2026 | $7.0B | -0.4% | 4.5% |
| MUSA Murphy USA | Q3 2026 | $6.9B | +35% | 3.8% |
| CASY Caseys General Stores | Q1 FY27 | $5.7B | +24% | 6.1% |
| ABG Asbury Automotive Group | Q3 2026 | $4.4B | -8% | 4.7% |
Source: Group 1 Automotive 10-Q on SEC EDGAR · CIK 1031203 · Retail-Auto Dealers & Gasoline Stations
Guidance and outlook
13F: who owns GPI and who is buying
More on GPI
History
Every quarter: Q3 2026 results · Q2 2026 results · Q1 2026 results · Q4 2025 results · Q3 2025 results · Q2 2025 results · Q1 2025 results
- Group 1 Automotive gross margin by quarter
- Group 1 Automotive operating margin by quarter
- Group 1 Automotive net income by quarter
- Group 1 Automotive free cash flow by quarter
- Group 1 Automotive capital expenditures by quarter
- Group 1 Automotive Total new and used vehicle sales revenue by quarter
- Group 1 Automotive Parts and service sales revenue by quarter
- Group 1 Automotive Finance, insurance and other, net revenue by quarter