Filing Flows › Consumer Discretionary › CarMax (KMX)
CarMax (KMX) earnings and revenue breakdown
Latest: Q2 FY27 · 10-Q filed Sep 30, 2026 · CarMax (KMX) Q2 FY27 earnings results →
Q2 FY27 Revenue up 20% year over year to $7.9B · 2¢ of every $1 of revenue kept as net profit · operating margin 2.8%
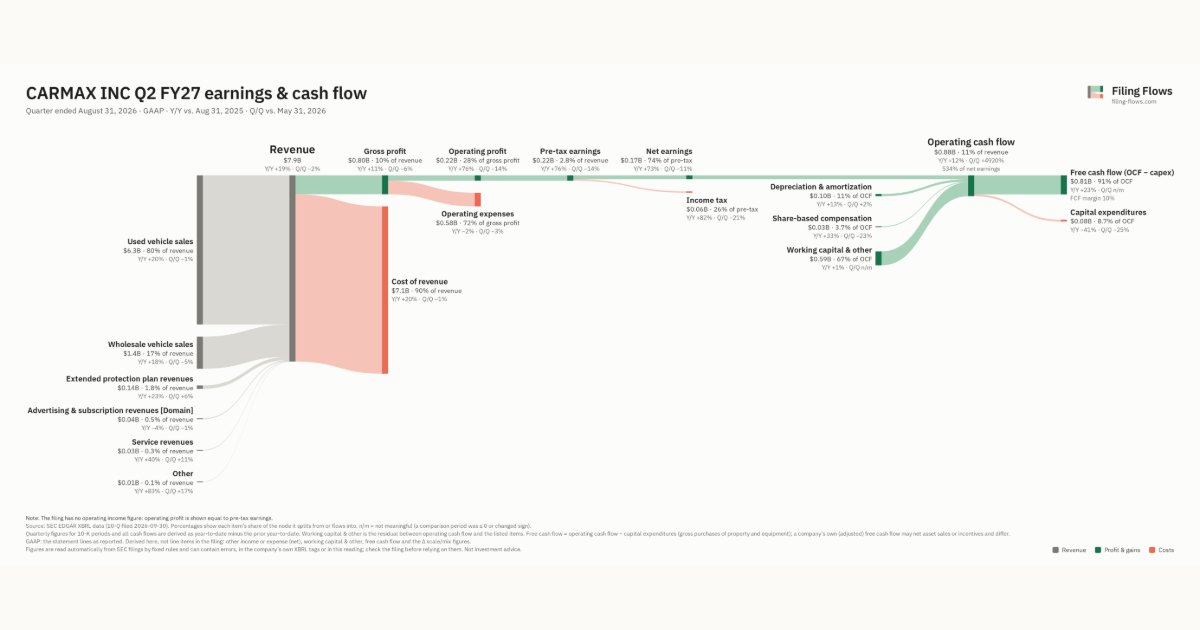
CarMax made $7.9B in Q2 FY27 (+20% Y/Y): Used vehicle sales $6.3B, Wholesale vehicle sales $1.4B, Extended protection plan revenues $142M. Operating margin 2.8%, net earnings $165M. See where every dollar goes — costs, profit and cash — as a Sankey from the 10-Q filed Sep 30, 2026.
Drawing the Sankey…
Open the interactive Sankey → click any line for what the company wrote about it, compare Y/Y and Q/Q, export as PNG or PDF
What changed this quarter
Revenue was $7.9B in Q2 FY27, up 19% year over year and down 2% from the previous quarter. Used vehicle sales was the largest line at 80% of revenue. Used vehicle sales added $1.0B year over year (up 20%), 81% of the total change. Advertising & subscription revenues declined 4%.
Gross margin was 10.1%, down 0.7 points from Q2 FY26. Operating profit was $0.22B, a 2.8% margin (up 0.9 points year over year). Of the extra revenue versus Q2 FY26, 7% reached operating profit, above the 2% margin then. Operating expenses fell 2% while revenue rose 19%. Net earnings were $0.17B, up 73% year over year. The effective tax rate was 25.9%.
Operating cash flow was $0.88B (up 12% year over year), 534% of net earnings. Non-cash charges added back $0.10B of depreciation and amortization and $0.03B of share-based compensation. Working capital and other items added $0.59B. Capital expenditures of $0.08B left free cash flow of $0.81B.
Quarterly history
| Quarter | Form | Filed | Revenue | Y/Y | Op. margin | Net earnings | Op. cash flow |
|---|---|---|---|---|---|---|---|
| Q2 FY27 | 10-Q | Sep 30, 2026 | $7.9B | +20% | 2.8% | $165M | $883M |
| Q1 FY27 | 10-Q | Jun 24, 2026 | $8.0B | +6% | 3.2% | $186M | $17.6M |
| Q4 FY26 | 10-K | Apr 15, 2026 | $5.9B | -1% | -1.9% | −$121M | −$554M |
| Q3 FY26 | 10-Q | Dec 23, 2025 | $5.8B | -7% | 1.4% | $62.2M | $1.3B |
| Q2 FY26 | 10-Q | Sep 26, 2025 | $6.6B | -6% | 1.9% | $95.4M | $785M |
| Q1 FY26 | 10-Q | Jun 26, 2025 | $7.5B | +6% | 3.8% | $210M | $300M |
| Q4 FY25 | 10-K | Apr 11, 2025 | $6.0B | +7% | 2.0% | $89.9M | $146M |
Charts
Interactive views
The same charts as the app — open one to draw it.
💵Where each $1 goesinteractive
Loading the interactive chart…
🌏Named in Asian annual reportsinteractive
Loading the interactive chart…
🔄Rotation against the market and its industry (RRG)interactive
Loading the interactive chart…
🔍Earnings qualityinteractive
Loading the interactive chart…
⚖️Fair value by methodinteractive
Loading the interactive chart…
🔭Outlook & guidanceinteractive
Loading the interactive chart…
📈Investments: gains and what it boughtinteractive
Loading the interactive chart…
🏭Its industry’s money flow (input-output)interactive
Loading the interactive chart…
About CarMax
CarMax, Inc. delivers an unrivaled customer experience by offering a broad selection of quality used vehicles and related products and services at competitive, no-haggle prices using a customer-friendly sales process. We are the nation’s largest retailer of used vehicles, and we sold 780,684 used vehicles at retail during the fiscal year ended February 28, 2026. We are also one of the nation’s largest operators of wholesale vehicle auctions, with 538,203 vehicles sold during fiscal 2026, and one of the nation’s largest providers of used vehicle financing, servicing approximately 1.0 million customer accounts in our $16.37 billion portfolio of auto loans as of February 28, 2026.
In its own words, from its 10-K, filed Apr 15, 2026.
CarMax against its Retail-Auto Dealers & Gasoline Stations peers
The largest companies of the same SEC industry, each at its latest quarter. Revenue growth: +20% against the peers' median +4%. Operating margin: 2.8% against the peers' median 4.2%.
| Company | Quarter | Revenue | Y/Y | Op. margin |
|---|---|---|---|---|
| KMX CarMax | Q2 FY27 | $7.9B | +20% | 2.8% |
| LAD Lithia Motors | Q3 2026 | $9.9B | +3% | 4.2% |
| PAG Penske Automotive Group | Q3 2026 | $8.4B | +4% | 3.6% |
| CVNA Carvana | Q3 2026 | $8.0B | +42% | 8.9% |
| AN Autonation | Q3 2026 | $7.0B | -0.4% | 4.5% |
| MUSA Murphy USA | Q3 2026 | $6.9B | +35% | 3.8% |
| CASY Caseys General Stores | Q1 FY27 | $5.7B | +24% | 6.1% |
| GPI Group 1 Automotive | Q3 2026 | $5.4B | -7% | 3.7% |
| ABG Asbury Automotive Group | Q3 2026 | $4.4B | -8% | 4.7% |
Source: CarMax 10-Q on SEC EDGAR · CIK 1170010 · Retail-Auto Dealers & Gasoline Stations
13F: who owns KMX and who is buying
More on KMX
History
Every quarter: Q2 FY27 results · Q1 FY27 results · Q4 FY26 results · Q3 FY26 results · Q2 FY26 results · Q1 FY26 results · Q4 FY25 results
- CarMax gross margin by quarter
- CarMax operating margin by quarter
- CarMax net income by quarter
- CarMax free cash flow by quarter
- CarMax capital expenditures by quarter
- CarMax Used vehicle sales revenue by quarter
- CarMax Wholesale vehicle sales revenue by quarter
- CarMax Extended protection plan revenues revenue by quarter