Filing Flows › Consumer Discretionary › Carvana (CVNA)
Carvana (CVNA) earnings and revenue breakdown
Latest: Q3 2026 · 10-Q filed Oct 28, 2026 · Carvana (CVNA) Q3 2026 earnings results →
Q3 2026 Revenue up 42% year over year to $8.0B · 4¢ of every $1 of revenue kept as net profit · operating margin 8.9%
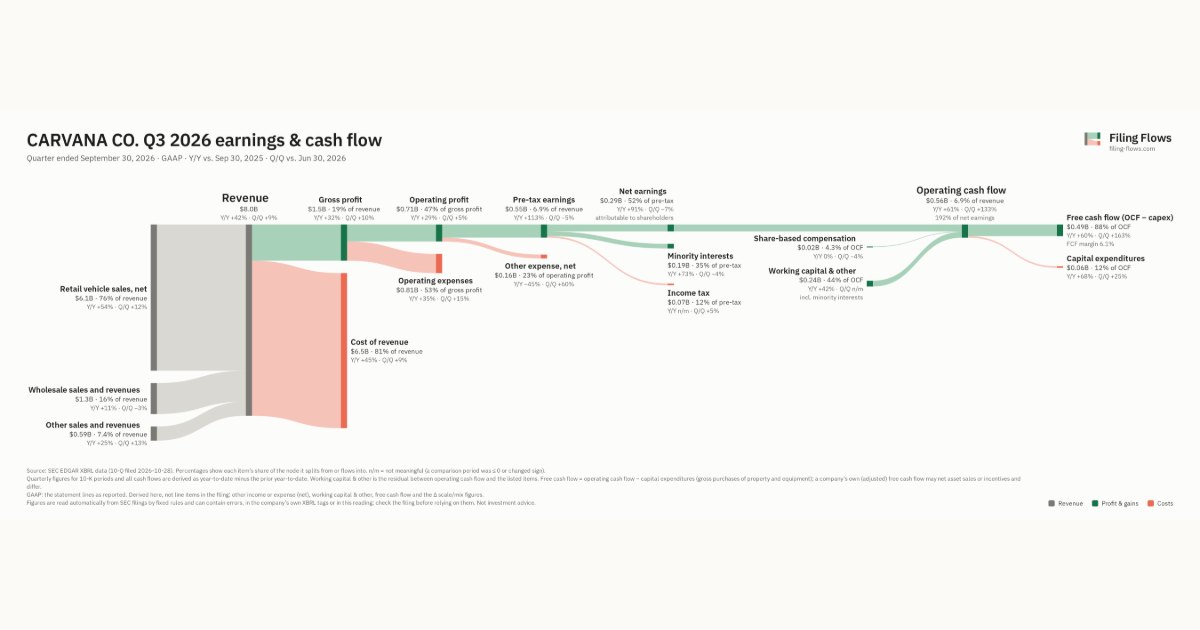
Carvana made $8.0B in Q3 2026 (+42% Y/Y): Retail vehicle sales, net $6.1B, Wholesale sales and revenues $1.3B, Other sales and revenues $594M. Operating margin 8.9%, net earnings $289M. See where every dollar goes — costs, profit and cash — as a Sankey from the 10-Q filed Oct 28, 2026.
Drawing the Sankey…
Open the interactive Sankey → click any line for what the company wrote about it, compare Y/Y and Q/Q, export as PNG or PDF
What changed this quarter
Revenue was $8.0B in Q3 2026, up 42% year over year and up 9% from the previous quarter. Retail vehicle sales, net was the largest line at 76% of revenue. Retail vehicle sales, net added $2.1B year over year (up 54%), 90% of the total change.
Gross margin was 18.9%, down 1.4 points from Q3 2025. Operating profit was $0.71B, a 8.9% margin (down 0.9 points year over year). Of the extra revenue versus Q3 2025, 7% reached operating profit, below the 10% margin then. Operating expenses grew 35% against revenue growth of 42%. Net earnings were $0.29B, up 91% year over year. The effective tax rate was 12.5%.
Operating cash flow was $0.56B (up 61% year over year), 115% of net income including minority interests. Non-cash charges added back $0.02B of share-based compensation. Working capital and other items added $0.05B. Capital expenditures of $0.06B left free cash flow of $0.49B.
Quarterly history
| Quarter | Form | Filed | Revenue | Y/Y | Op. margin | Net earnings | Op. cash flow |
|---|---|---|---|---|---|---|---|
| Q3 2026 | 10-Q | Oct 28, 2026 | $8.0B | +42% | 8.9% | $289M | $555M |
| Q2 2026 | 10-Q | Jul 29, 2026 | $7.4B | +52% | 9.2% | $310M | $238M |
| Q1 2026 | 10-Q | Apr 29, 2026 | $6.4B | +52% | 9.0% | $250M | $107M |
| Q4 2025 | 10-K | Feb 18, 2026 | $5.6B | +58% | 7.6% | $951M | $430M |
| Q3 2025 | 10-Q | Oct 29, 2025 | $5.6B | +54% | 9.8% | $151M | $345M |
| Q2 2025 | 10-Q | Jul 30, 2025 | $4.8B | +42% | 10.6% | $183M | $29.0M |
| Q1 2025 | 10-Q | May 7, 2025 | $4.2B | +38% | 9.3% | $216M | $232M |
Charts
Interactive views
The same charts as the app — open one to draw it.
💵Where each $1 goesinteractive
Loading the interactive chart…
🌏Named in Asian annual reportsinteractive
Loading the interactive chart…
🔄Rotation against the market and its industry (RRG)interactive
Loading the interactive chart…
🔍Earnings qualityinteractive
Loading the interactive chart…
⚖️Fair value by methodinteractive
Loading the interactive chart…
🔭Outlook & guidanceinteractive
Loading the interactive chart…
📈Investments: gains and what it boughtinteractive
Loading the interactive chart…
🏭Its industry’s money flow (input-output)interactive
Loading the interactive chart…
About Carvana
Carvana Co. is a holding company that was formed as a Delaware corporation in 2016 in order to operate the business of Carvana Group, LLC and its subsidiaries (collectively, "Carvana Group"). Carvana Co. Class A common stock trades on the New York Stock Exchange ("NYSE") under the symbol "CVNA." Carvana is the leading e-commerce platform for buying and selling used cars. We are transforming the used car buying and selling experience by giving consumers what they want - a wide selection, great value and quality, transparent pricing, and a simple, no pressure transaction. Our differentiated business model combines a comprehensive online sales experience with a vertically integrated supply chain, designed to sell high-quality vehicles to our customers transparently and efficiently at a low price.
In its own words, from its 10-K, filed Feb 18, 2026.
Carvana against its Retail-Auto Dealers & Gasoline Stations peers
The largest companies of the same SEC industry, each at its latest quarter. Revenue growth: +42% against the peers' median +4%. Operating margin: 8.9% against the peers' median 4.2%.
| Company | Quarter | Revenue | Y/Y | Op. margin |
|---|---|---|---|---|
| CVNA Carvana | Q3 2026 | $8.0B | +42% | 8.9% |
| LAD Lithia Motors | Q3 2026 | $9.9B | +3% | 4.2% |
| PAG Penske Automotive Group | Q3 2026 | $8.4B | +4% | 3.6% |
| KMX CarMax | Q2 FY27 | $7.9B | +20% | 2.8% |
| AN Autonation | Q3 2026 | $7.0B | -0.4% | 4.5% |
| MUSA Murphy USA | Q3 2026 | $6.9B | +35% | 3.8% |
| CASY Caseys General Stores | Q1 FY27 | $5.7B | +24% | 6.1% |
| GPI Group 1 Automotive | Q3 2026 | $5.4B | -7% | 3.7% |
| ABG Asbury Automotive Group | Q3 2026 | $4.4B | -8% | 4.7% |
Source: Carvana 10-Q on SEC EDGAR · CIK 1690820 · Retail-Auto Dealers & Gasoline Stations
Guidance and outlook
13F: who owns CVNA and who is buying
More on CVNA
History
Every quarter: Q3 2026 results · Q2 2026 results · Q1 2026 results · Q4 2025 results · Q3 2025 results · Q2 2025 results · Q1 2025 results
- Carvana guidance history: guided vs reported
- Carvana gross margin by quarter
- Carvana operating margin by quarter
- Carvana net income by quarter
- Carvana free cash flow by quarter
- Carvana capital expenditures by quarter
- Carvana Retail vehicle sales, net revenue by quarter
- Carvana Wholesale sales and revenues revenue by quarter
- Carvana Other sales and revenues revenue by quarter