Filing Flows › Consumer Discretionary › Bath & Body Works (BBWI)
Bath & Body Works (BBWI) earnings and revenue breakdown
Latest: Q2 FY27 · 10-Q filed Aug 26, 2026 · Bath & Body Works (BBWI) Q2 FY27 earnings results →
Q2 FY27 Revenue down 2% year over year to $1.5B · 8¢ of every $1 of revenue kept as net profit · operating margin 14.3%
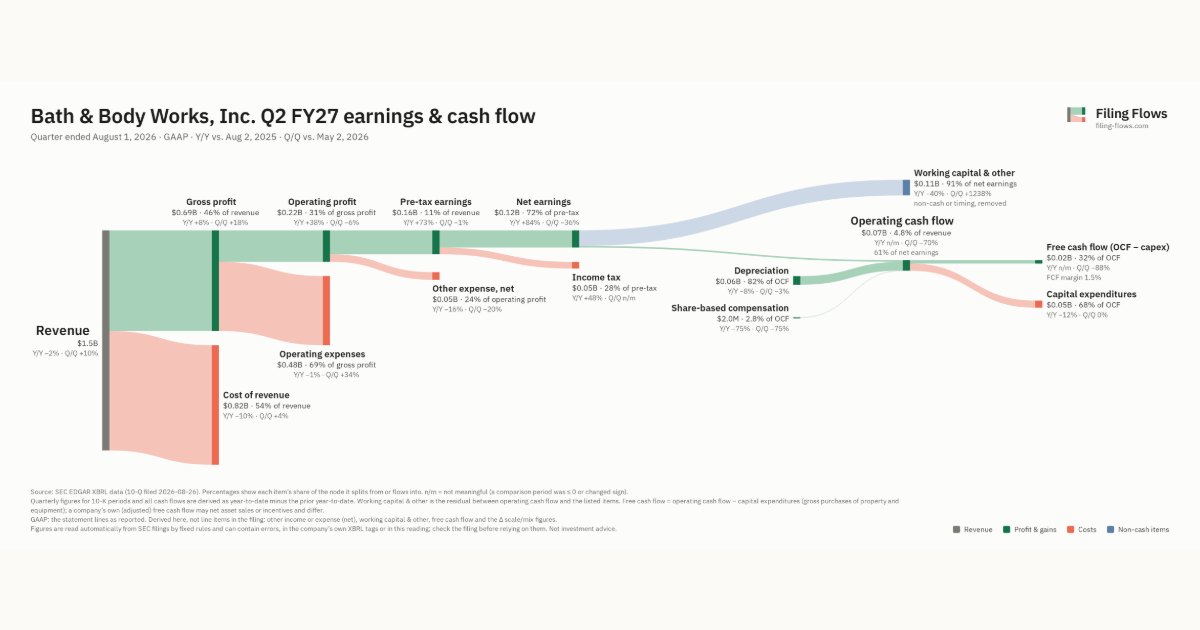
Bath & Body Works made $1.5B in Q2 FY27 (-2% Y/Y). Operating margin 14.3%, net earnings $118M. See where every dollar goes — costs, profit and cash — as a Sankey from the 10-Q filed Aug 26, 2026.
Drawing the Sankey…
Open the interactive Sankey → click any line for what the company wrote about it, compare Y/Y and Q/Q, export as PNG or PDF
What changed this quarter
Revenue was $1.5B in Q2 FY27, down 2% year over year and up 10% from the previous quarter.
Gross margin was 45.7%, up 4.4 points from Q2 FY26. Operating profit was $0.22B, a 14.3% margin (up 4.1 points year over year). Operating expenses fell 1% while revenue fell 2%. Net earnings were $0.12B, up 84% year over year. The effective tax rate was 28.0%.
Operating cash flow was $0.07B, 61% of net earnings. Non-cash charges added back $0.06B of depreciation and $2.0M of share-based compensation. Working capital and other items used $0.11B. Capital expenditures of $0.05B left free cash flow of $0.02B.
Quarterly history
| Quarter | Form | Filed | Revenue | Y/Y | Op. margin | Net earnings | Op. cash flow |
|---|---|---|---|---|---|---|---|
| Q2 FY27 | 10-Q | Aug 26, 2026 | $1.5B | -2% | 14.3% | $118M | $72.0M |
| Q1 FY27 | 10-Q | May 27, 2026 | $1.4B | -3% | 16.8% | $183M | $244M |
| Q4 FY26 | 10-K | Mar 12, 2026 | $2.7B | -2% | 22.0% | $403M | $877M |
| Q3 FY26 | 10-Q | Nov 20, 2025 | $1.6B | -1% | 10.1% | $77.0M | $80.0M |
| Q2 FY26 | 10-Q | Aug 28, 2025 | $1.5B | +2% | 10.1% | $64.0M | −$43.0M |
| Q1 FY26 | 10-Q | May 29, 2025 | $1.4B | +3% | 14.7% | $105M | $188M |
| Q4 FY25 | 10-K | Mar 14, 2025 | $2.8B | -4% | 24.3% | $453M | $955M |
Charts
Interactive views
The same charts as the app — open one to draw it.
💵Where each $1 goesinteractive
Loading the interactive chart…
🌏Named in Asian annual reportsinteractive
Loading the interactive chart…
🔄Rotation against the market and its industry (RRG)interactive
Loading the interactive chart…
🔍Earnings qualityinteractive
Loading the interactive chart…
⚖️Fair value by methodinteractive
Loading the interactive chart…
🔭Outlook & guidanceinteractive
Loading the interactive chart…
📈Investments: gains and what it boughtinteractive
Loading the interactive chart…
🏭Its industry’s money flow (input-output)interactive
Loading the interactive chart…
About Bath & Body Works
Bath & Body Works is a global leader in personal care and home fragrance, driven by the belief that everybody deserves to feel good. For over 35 years, the brand’s beloved and iconic scents have been expertly crafted for exceptional performance and a luxury fragrance experience. Formulated with thoughtfully chosen ingredients, Bath & Body Works’ body care products are available in multiple forms including fine fragrance mist, body cream, lotion, eau de parfum, body wash, hand soap, sanitizer and more, and home to our famous 3-wick candles. Consumers can shop Bath & Body Works anytime and anywhere they choose, from welcoming, in-store experiences at 1,927 company-operated stores in the United States of America (“U.S”) and Canada, our e-commerce sites in the U.S. and Canada, 573 international stores and 34 e-commerce sites in more than 45 other countries, as well as Amazon.
In its own words, from its 10-K, filed Mar 12, 2026.
Bath & Body Works against its Retail-Retail Stores, NEC peers
The largest companies of the same SEC industry, each at its latest quarter. Revenue growth: -2% against the peers' median 0%. Operating margin: 14.3% against the peers' median 3.2%.
| Company | Quarter | Revenue | Y/Y | Op. margin |
|---|---|---|---|---|
| BBWI Bath & Body Works | Q2 FY27 | $1.5B | -2% | 14.3% |
| ULTA Ulta Beauty | Q2 FY27 | $3.0B | +9% | 12.5% |
| WOOF Petco Health & Wellness Company | Q2 FY27 | $1.5B | 0% | 3.2% |
| SBH Sally Beauty Holdings | Q3 FY26 | $935M | +0.2% | 9.2% |
| TITN Titan Machinery | Q2 FY27 | $496M | -9% | -0.5% |
| LESL Leslie's | Q3 FY26 | $458M | -8% | 13.4% |
| SGU Star Group, L.P. | Q3 FY26 | $358M | +17% | -9.5% |
| FLWS 1 800 Flowers | Q1 FY27 | $171M | -11% | -27.1% |
| RENT Rent the Runway | Q2 FY27 | $97.7M | +21% | -8.0% |
Source: Bath & Body Works 10-Q on SEC EDGAR · CIK 701985 · Retail-Retail Stores, NEC
Guidance and outlook
13F: who owns BBWI and who is buying
More on BBWI
History
Every quarter: Q2 FY27 results · Q1 FY27 results · Q4 FY26 results · Q3 FY26 results · Q2 FY26 results · Q1 FY26 results · Q4 FY25 results