Filing Flows › Consumer Discretionary › Petco Health & Wellness Company (WOOF)
Petco Health & Wellness Company (WOOF) earnings and revenue breakdown
Latest: Q2 FY27 · 10-Q filed Sep 4, 2026 · Petco Health & Wellness Company (WOOF) Q2 FY27 earnings results →
Q2 FY27 Revenue up 0% year over year to $1.5B · 3¢ of every $1 of revenue kept as net profit · operating margin 3.2%
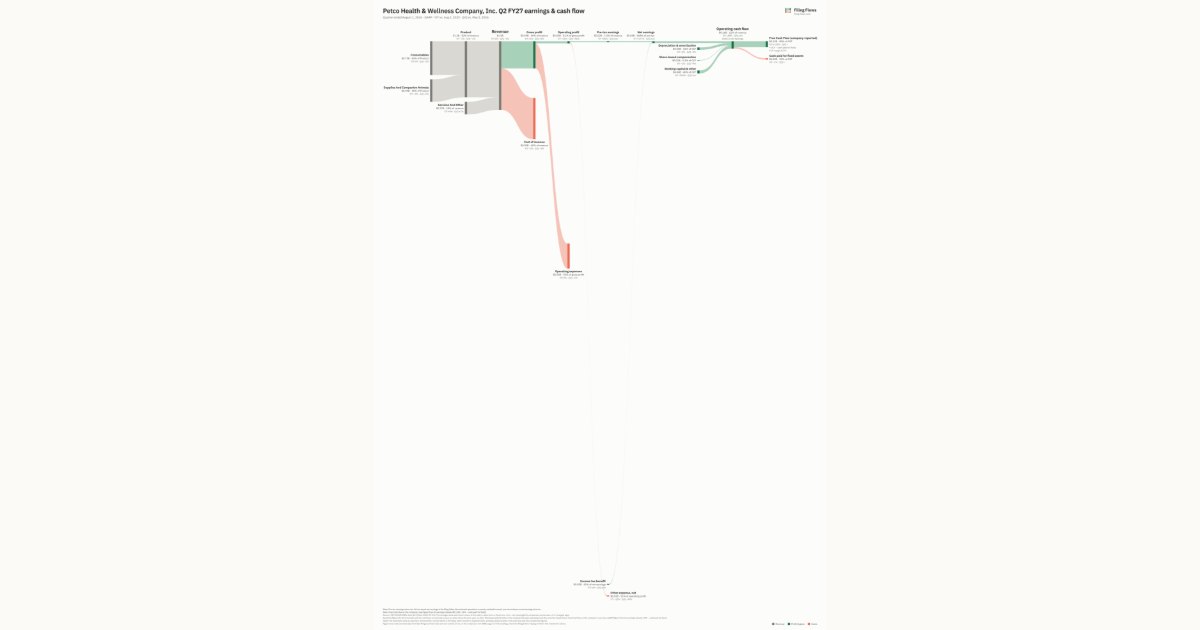
Petco Health & Wellness Company made $1.5B in Q2 FY27 (0% Y/Y): Product $1.2B, Services and Other $272M. Operating margin 3.2%, net earnings $38.7M. See where every dollar goes — costs, profit and cash — as a Sankey from the 10-Q filed Sep 4, 2026.
Drawing the Sankey…
Open the interactive Sankey → click any line for what the company wrote about it, compare Y/Y and Q/Q, export as PNG or PDF
What changed this quarter
Revenue was $1.5B in Q2 FY27, roughly flat year over year and down 1% from the previous quarter. Consumables was the largest line at 49% of revenue. Services and Other added $0.01B year over year (up 4%), 1366% of the total change. Supplies and Companion Animals declined 2%.
Gross margin was 39.7%, up 0.4 points from Q2 FY26. Operating profit was $0.05B, a 3.2% margin (up 0.3 points year over year). Of the extra revenue versus Q2 FY26, 693% reached operating profit, above the 3% margin then. Operating expenses grew 0% against flat revenue. Net earnings were $0.04B, up 177% year over year. The effective tax rate was -68.5%.
Operating cash flow was $0.16B (up 88% year over year), 418% of net earnings. Non-cash charges added back $0.05B of depreciation and amortization and $0.01B of share-based compensation. Working capital and other items added $0.06B. After cash paid for fixed assets ($0.03B), free cash flow as the company reports it was $0.13B.
Quarterly history
| Quarter | Form | Filed | Revenue | Y/Y | Op. margin | Net earnings | Op. cash flow |
|---|---|---|---|---|---|---|---|
| Q2 FY27 | 10-Q | Sep 4, 2026 | $1.5B | 0% | 3.2% | $38.7M | $162M |
| Q1 FY27 | 10-Q | Jun 5, 2026 | $1.5B | +0.2% | 1.6% | −$15.1M | −$31.0M |
| Q4 FY26 | 10-K | Mar 13, 2026 | $1.5B | -2% | 2.1% | −$2.6M | $154M |
| Q3 FY26 | 10-Q | Dec 5, 2025 | $1.5B | -3% | 2.0% | $9.3M | $90.1M |
| Q2 FY26 | 10-Q | Aug 29, 2025 | $1.5B | -2% | 2.9% | $14.0M | $85.9M |
| Q1 FY26 | 10-Q | Jun 6, 2025 | $1.5B | -2% | 1.1% | −$11.7M | −$15.5M |
| Q4 FY25 | 10-K | Mar 31, 2025 | $1.6B | -7% | 1.1% | −$13.8M | $96.0M |
Charts
Interactive views
The same charts as the app — open one to draw it.
💵Where each $1 goesinteractive
Loading the interactive chart…
🌏Named in Asian annual reportsinteractive
Loading the interactive chart…
🔄Rotation against the market and its industry (RRG)interactive
Loading the interactive chart…
🔍Earnings qualityinteractive
Loading the interactive chart…
⚖️Fair value by methodinteractive
Loading the interactive chart…
🔭Outlook & guidanceinteractive
Loading the interactive chart…
📈Investments: gains and what it boughtinteractive
Loading the interactive chart…
🏭Its industry’s money flow (input-output)interactive
Loading the interactive chart…
About Petco Health & Wellness Company
We're proud to be "where the pets go" to find everything they need to live their best lives for more than 60 years — from their favorite meals and toys, to trusted supplies and expert support from people who get it, because we live it. We believe in the universal truths of pet parenthood — the boundless boops, missing slippers, late night zoomies and everything in between. And we're here for it. Every tail wag, every vet visit, every step of the way. We nurture the pet-human bond in the aisles of more than 1,500 Petco stores across the U.S., Mexico and Chile. Customers experience our exclusive selection of pet care products, services, expertise and membership offerings in stores and online at petco.com , and on the Petco app . In 1999, we founded Petco Love .
In its own words, from its 8-K, filed Sep 2, 2026.
Petco Health & Wellness Company against its Retail-Retail Stores, NEC peers
The largest companies of the same SEC industry, each at its latest quarter. Revenue growth: 0% against the peers' median 0%. Operating margin: 3.2% against the peers' median 3.2%.
| Company | Quarter | Revenue | Y/Y | Op. margin |
|---|---|---|---|---|
| WOOF Petco Health & Wellness Company | Q2 FY27 | $1.5B | 0% | 3.2% |
| ULTA Ulta Beauty | Q2 FY27 | $3.0B | +9% | 12.5% |
| BBWI Bath & Body Works | Q2 FY27 | $1.5B | -2% | 14.3% |
| SBH Sally Beauty Holdings | Q3 FY26 | $935M | +0.2% | 9.2% |
| TITN Titan Machinery | Q2 FY27 | $496M | -9% | -0.5% |
| LESL Leslie's | Q3 FY26 | $458M | -8% | 13.4% |
| SGU Star Group, L.P. | Q3 FY26 | $358M | +17% | -9.5% |
| FLWS 1 800 Flowers | Q1 FY27 | $171M | -11% | -27.1% |
| RENT Rent the Runway | Q2 FY27 | $97.7M | +21% | -8.0% |
Source: Petco Health & Wellness Company 10-Q on SEC EDGAR · CIK 1826470 · Retail-Retail Stores, NEC
13F: who owns WOOF and who is buying
More on WOOF
History
Every quarter: Q2 FY27 results · Q1 FY27 results · Q4 FY26 results · Q3 FY26 results · Q2 FY26 results · Q1 FY26 results · Q4 FY25 results
- Petco Health & Wellness Company gross margin by quarter
- Petco Health & Wellness Company operating margin by quarter
- Petco Health & Wellness Company net income by quarter
- Petco Health & Wellness Company free cash flow by quarter
- Petco Health & Wellness Company capital expenditures by quarter
- Petco Health & Wellness Company Product revenue by quarter
- Petco Health & Wellness Company Services and Other revenue by quarter