Filing Flows › Consumer Discretionary › Old QVC Group
Old QVC Group earnings and revenue breakdown
Latest: Q2 2026 · 10-Q filed Aug 4, 2026
Q2 2026 Revenue down 11% year over year to $2.0B · 2¢ of every $1 of revenue lost · operating margin 2.6%
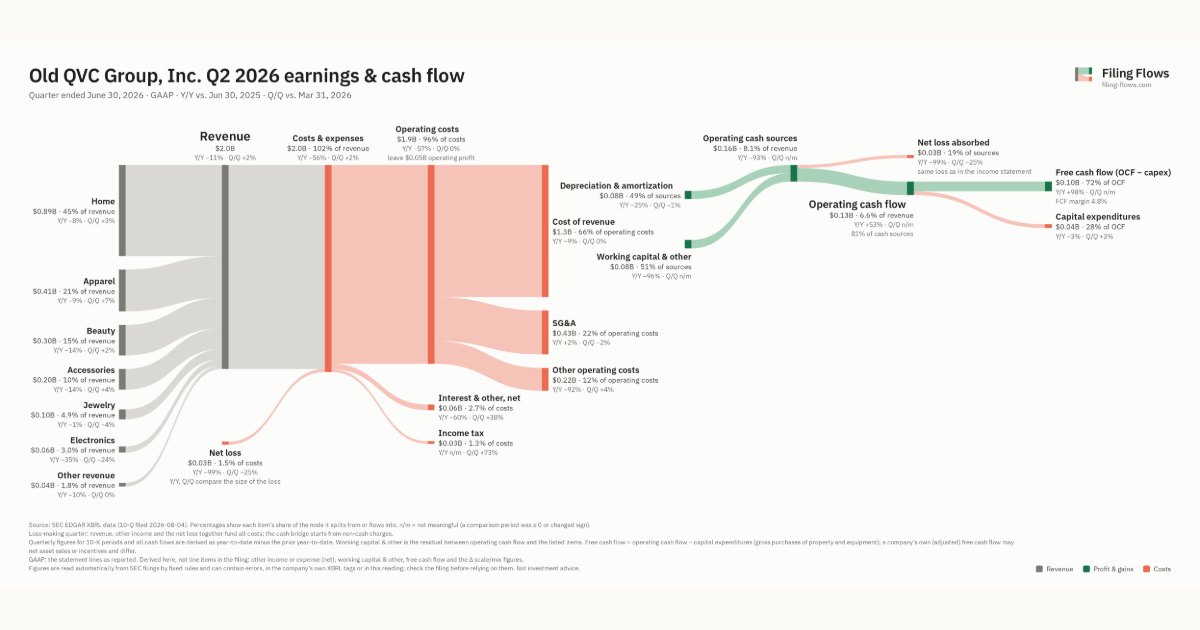
Old QVC Group made $2.0B in Q2 2026 (-11% Y/Y): Home $892M, Apparel $410M, Beauty $299M. Operating margin 2.6%, net loss $30.0M. See where every dollar goes — costs, profit and cash — as a Sankey from the 10-Q filed Aug 4, 2026.
Drawing the Sankey…
Open the interactive Sankey → click any line for what the company wrote about it, compare Y/Y and Q/Q, export as PNG or PDF
What changed this quarter
Revenue was $2.0B in Q2 2026, down 11% year over year and up 2% from the previous quarter. Home was the largest line at 45% of revenue. Home lost $0.08B year over year (down 8%), 34% of the total change.
Gross margin was 35.3%, down 1.1 points from Q2 2025. Operating profit was $0.05B, a 2.6% margin (up 104.2 points year over year). Operating expenses fell 79% while revenue fell 11%. The quarter ended with a net loss of $0.03B, narrower than the previous quarter's $0.04B loss. Net interest and other expense of $0.06B was the main reason.
Operating cash flow was $0.13B (up 53% year over year). Non-cash charges added back $0.08B of depreciation and amortization. Working capital and other items added $0.08B. Capital expenditures of $0.04B left free cash flow of $0.10B.
Quarterly history
| Quarter | Form | Filed | Revenue | Y/Y | Op. margin | Net earnings | Op. cash flow |
|---|---|---|---|---|---|---|---|
| Q2 2026 | 10-Q | Aug 4, 2026 | $2.0B | -11% | 2.6% | −$30.0M | $132M |
| Q1 2026 | 10-Q | May 15, 2026 | $2.0B | -7% | 0.8% | −$40.0M | −$189M |
| Q4 2025 | 10-K | Apr 15, 2026 | $2.7B | -9% | 3.8% | −$25.0M | $244M |
| Q3 2025 | 10-Q | Nov 5, 2025 | $2.2B | -6% | 2.7% | −$73.0M | $4.0M |
| Q2 2025 | 10-Q | Aug 7, 2025 | $2.2B | -7% | -101.6% | −$2.2B | $86.0M |
| Q1 2025 | 10-Q | May 7, 2025 | $2.1B | -10% | 0.7% | −$91.0M | −$60.0M |
| Q4 2024 | 10-K | Feb 27, 2025 | $2.9B | -6% | -43.2% | −$1.3B | $212M |
Charts
Interactive views
The same charts as the app — open one to draw it.
💵Where each $1 goesinteractive
Loading the interactive chart…
🌏Named in Asian annual reportsinteractive
Loading the interactive chart…
🏭Its industry’s money flow (input-output)interactive
Loading the interactive chart…
About Old QVC Group
QVC Group, Inc. ("QVC Group", the “Company”, “we”, “us” and “our”), formerly known as Qurate Retail, Inc., owns interests in subsidiaries and other companies which are primarily engaged in the video and online commerce industries. Through our subsidiaries and affiliates, we operate in North America, Europe and Asia. Our principal businesses and assets include our consolidated subsidiaries QVC, Inc. ("QVC"), Cornerstone Brands, Inc. (“CBI”), and other equity investments. Our largest businesses and reportable segments are QxH (QVC U.S. and HSN, Inc. (“HSN”)), QVC International and CBI.
In its own words, from its 10-K, filed Apr 15, 2026.
Old QVC Group against its Retail-Catalog & Mail-Order Houses peers
The largest companies of the same SEC industry, each at its latest quarter. Revenue growth: -11% against the peers' median +10%. Operating margin: 2.6% against the peers' median 3.1%.
| Company | Quarter | Revenue | Y/Y | Op. margin |
|---|---|---|---|---|
| Old QVC Group | Q2 2026 | $2.0B | -11% | 2.6% |
| AMZN Amazon.com | Q3 2026 | $201.9B | +12% | 13.9% |
| CPNG Coupang | Q3 2026 | $10.0B | +8% | -4.5% |
| CDW CDW | Q3 2026 | $6.8B | +18% | 7.2% |
| W Wayfair | Q3 2026 | $3.4B | +10% | 3.1% |
| CHWY Chewy | Q2 FY27 | $3.3B | +7% | 2.8% |
| NSIT Insight Enterprises | Q3 2026 | $2.4B | +22% | 2.8% |
| QVCG QVC Group | Q2 2026 | $1.8B | -11% | 3.5% |
| PTRN Pattern Group | Q3 2026 | $886M | +38% | 4.2% |
Source: Old QVC Group 10-Q on SEC EDGAR · CIK 1355096 · Retail-Catalog & Mail-Order Houses