Filing Flows › Financials › Huntington Bancshares (HBAN)
Huntington Bancshares (HBAN) earnings and revenue breakdown
Latest: Q3 2026 · 10-Q filed Oct 27, 2026 · Huntington Bancshares (HBAN) Q3 2026 earnings results →
Q3 2026 Revenue up 31% year over year to $2.8B · 26¢ of every $1 of revenue kept as net profit · operating margin 32.1%
Huntington Bancshares made $2.8B in Q3 2026 (+31% Y/Y). Operating margin 32.1%, net earnings $721M. See where every dollar goes — costs, profit and cash — as a Sankey from the 10-Q filed Oct 27, 2026.
Drawing the Sankey…
Open the interactive Sankey → click any line for what the company wrote about it, compare Y/Y and Q/Q, export as PNG or PDF
What changed this quarter
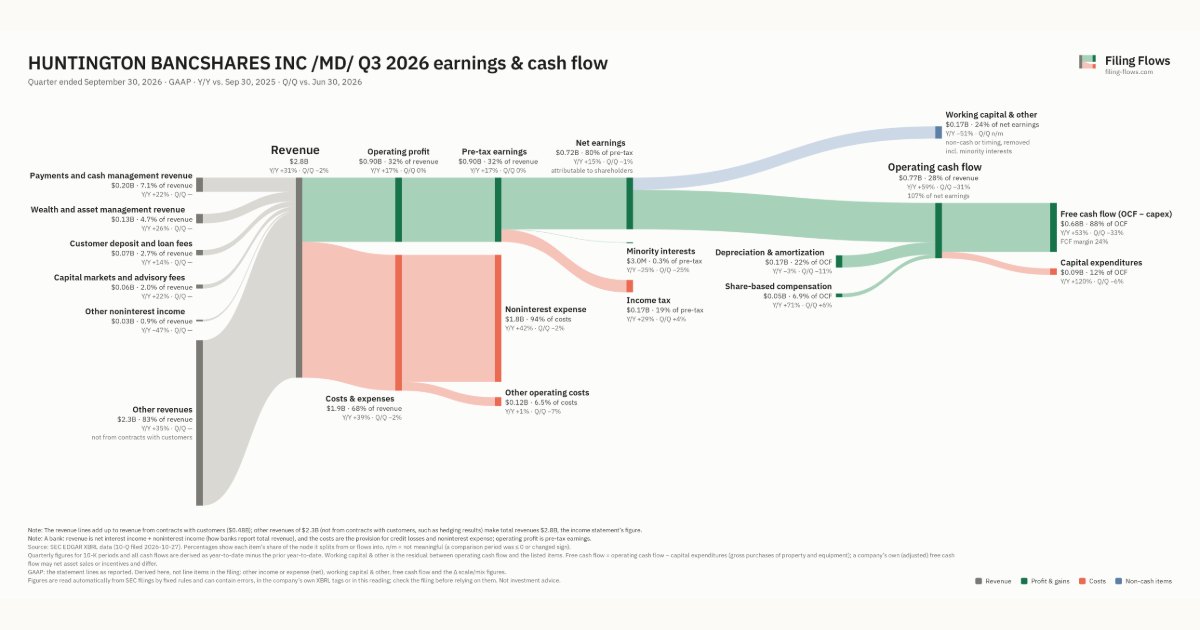
Revenue was $2.8B in Q3 2026, up 31% year over year and down 2% from the previous quarter.
Operating profit was $0.90B, a 32.1% margin (down 3.8 points year over year). Of the extra revenue versus Q3 2025, 20% reached operating profit, below the 36% margin then. Total costs grew 39% against revenue growth of 31%. The fastest-growing cost line was Noninterest expense (+42%). Net earnings were $0.72B, up 15% year over year. The effective tax rate was 19.2%.
Operating cash flow was $0.77B (up 59% year over year), 107% of net earnings. Non-cash charges added back $0.17B of depreciation and amortization and $0.05B of share-based compensation. Working capital and other items used $0.17B. Capital expenditures of $0.09B left free cash flow of $0.68B.
Quarterly history
| Quarter | Form | Filed | Revenue | Y/Y | Op. margin | Net earnings | Op. cash flow |
|---|---|---|---|---|---|---|---|
| Q3 2026 | 10-Q | Oct 27, 2026 | $2.8B | +31% | 32.1% | $721M | $773M |
| Q2 2026 | 10-Q | Jul 28, 2026 | $2.8B | +46% | 31.6% | $727M | $1.1B |
| Q1 2026 | 10-Q | Apr 30, 2026 | $2.6B | +34% | 24.9% | $523M | $524M |
| Q4 2025 | 10-K | Feb 13, 2026 | $2.2B | +11% | 29.0% | $519M | $928M |
| Q3 2025 | 10-Q | Oct 28, 2025 | $2.1B | +14% | 35.9% | $629M | $487M |
| Q2 2025 | 10-Q | Jul 29, 2025 | $1.9B | +8% | 32.9% | $536M | $554M |
| Q1 2025 | 10-Q | Apr 29, 2025 | $1.9B | +10% | 34.0% | $527M | $513M |
Charts
Interactive views
The same charts as the app — open one to draw it.
💵Where each $1 goesinteractive
Loading the interactive chart…
🌏Named in Asian annual reportsinteractive
Loading the interactive chart…
🔄Rotation against the market and its industry (RRG)interactive
Loading the interactive chart…
🔍Earnings qualityinteractive
Loading the interactive chart…
⚖️Fair value by methodinteractive
Loading the interactive chart…
🔭Outlook & guidanceinteractive
Loading the interactive chart…
📈Investments: gains and what it boughtinteractive
Loading the interactive chart…
🏭Its industry’s money flow (input-output)interactive
Loading the interactive chart…
About Huntington Bancshares
We are a multi-state diversified regional bank holding company organized under Maryland law in 1966 and headquartered in Columbus, Ohio. Through the Bank, we are committed to making people’s lives better, helping businesses thrive, and strengthening the communities we serve, and we have been servicing the financial needs of our customers since 1866. Through our subsidiaries, we provide full-service commercial and consumer deposit, lending, and other banking and financial services. These include, but are not limited to, payments, mortgage banking, direct and indirect consumer financing, investment banking, capital markets, advisory, equipment financing, distribution finance, investment management, trust, brokerage, insurance, and other financial products and services. As of December 31, 2025, we operated more than 1,000 branches in 14 states.
In its own words, from its 10-K, filed Feb 13, 2026.
Huntington Bancshares against its National Commercial Banks peers
The largest companies of the same SEC industry, each at its latest quarter. Revenue growth: +31% against the peers' median +8%. Operating margin: 32.1% against the peers' median 32.1%.
| Company | Quarter | Revenue | Y/Y | Op. margin |
|---|---|---|---|---|
| HBAN Huntington Bancshares | Q3 2026 | $2.8B | +31% | 32.1% |
| JPM JPMorgan Chase | Q3 2026 | $50.2B | +8% | 40.1% |
| BAC Bank of America | Q3 2026 | $30.0B | +3% | 29.9% |
| C Citigroup | Q3 2026 | $23.8B | +8% | 30.6% |
| WFC Wells Fargo | Q3 2026 | $21.9B | +2% | 32.5% |
| COF Capital One Financial | Q3 2026 | $16.3B | +6% | 28.0% |
| USB US Bancorp | Q3 2026 | $8.0B | +9% | 35.1% |
| PNC PNC Financial Services Group | Q3 2026 | $6.6B | +11% | 40.0% |
| TFC Truist Financial | Q3 2026 | $3.7B | -28% | 23.9% |
Source: Huntington Bancshares 10-Q on SEC EDGAR · CIK 49196 · National Commercial Banks
Guidance and outlook
13F: who owns HBAN and who is buying
More on HBAN
History
Every quarter: Q3 2026 results · Q2 2026 results · Q1 2026 results · Q4 2025 results · Q3 2025 results · Q2 2025 results · Q1 2025 results