Filing Flows › Consumer Discretionary › Rush Enterprises (RUSHA)
Rush Enterprises (RUSHA) earnings and revenue breakdown
Latest: Q3 2026 · 10-Q filed Nov 6, 2026 · Rush Enterprises (RUSHA) Q3 2026 earnings results →
Q3 2026 Revenue up 12% year over year to $2.1B · 4¢ of every $1 of revenue kept as net profit · operating margin 5.1%
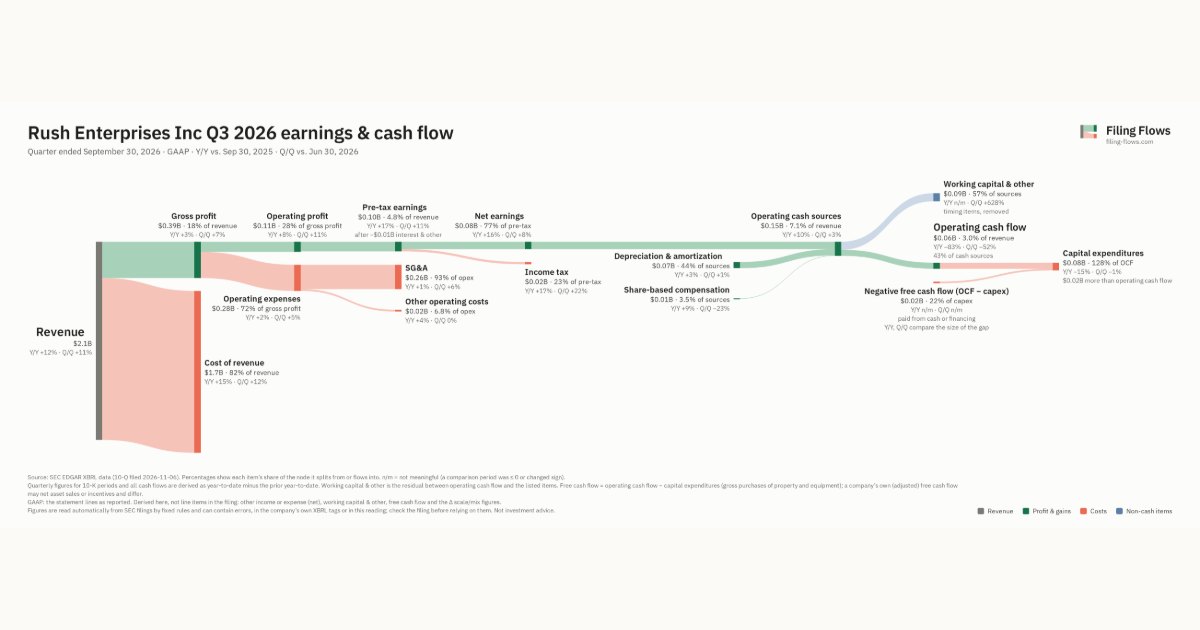
Rush Enterprises made $2.1B in Q3 2026 (+12% Y/Y). Operating margin 5.1%, net earnings $78.9M. See where every dollar goes — costs, profit and cash — as a Sankey from the 10-Q filed Nov 6, 2026.
Drawing the Sankey…
Open the interactive Sankey → click any line for what the company wrote about it, compare Y/Y and Q/Q, export as PNG or PDF
What changed this quarter
Revenue was $2.1B in Q3 2026, up 12% year over year and up 11% from the previous quarter.
Gross margin was 18.3%, down 1.6 points from Q3 2025. Operating profit was $0.11B, a 5.1% margin (down 0.2 points year over year). Of the extra revenue versus Q3 2025, 3% reached operating profit, below the 5% margin then. Operating expenses grew 2% against revenue growth of 12%. Net earnings were $0.08B, up 17% year over year. The effective tax rate was 23.0%.
Operating cash flow was $0.06B (down 83% year over year), 81% of net earnings. Non-cash charges added back $0.07B of depreciation and amortization and $0.01B of share-based compensation. Working capital and other items used $0.09B. Capital expenditures of $0.08B exceeded it, leaving free cash flow of −$0.02B.
Quarterly history
| Quarter | Form | Filed | Revenue | Y/Y | Op. margin | Net earnings | Op. cash flow |
|---|---|---|---|---|---|---|---|
| Q3 2026 | 10-Q | Nov 6, 2026 | $2.1B | +12% | 5.1% | $78.9M | $63.9M |
| Q2 2026 | 10-Q | Aug 7, 2026 | $1.9B | -2% | 5.1% | $73.0M | $133M |
| Q1 2026 | 10-Q | May 8, 2026 | $1.7B | -9% | 4.9% | $61.7M | $60.4M |
| Q4 2025 | 10-K | Feb 25, 2026 | $1.8B | -12% | 5.2% | $64.7M | $113M |
| Q3 2025 | 10-Q | Nov 7, 2025 | $1.9B | -0.8% | 5.3% | $67.7M | $368M |
| Q2 2025 | 10-Q | Aug 8, 2025 | $1.9B | -5% | 5.7% | $73.0M | $228M |
| Q1 2025 | 10-Q | May 9, 2025 | $1.9B | -1% | 5.0% | $60.6M | $154M |
Charts
Interactive views
The same charts as the app — open one to draw it.
💵Where each $1 goesinteractive
Loading the interactive chart…
🌏Named in Asian annual reportsinteractive
Loading the interactive chart…
🔄Rotation against the market and its industry (RRG)interactive
Loading the interactive chart…
🔍Earnings qualityinteractive
Loading the interactive chart…
⚖️Fair value by methodinteractive
Loading the interactive chart…
🔭Outlook & guidanceinteractive
Loading the interactive chart…
📈Investments: gains and what it boughtinteractive
Loading the interactive chart…
🏭Its industry’s money flow (input-output)interactive
Loading the interactive chart…
Customers and suppliers named in filings
Buys from
- F · Stated in 10-K (named, share not stated) · source
- BLBD · Stated in 10-K (named, share not stated) · source
About Rush Enterprises
References herein to “the Company,” “Rush Enterprises,” “we,” “our” or “us” mean Rush Enterprises, Inc., a Texas corporation, and its subsidiaries unless the context requires otherwise. We electronically file annual reports, quarterly reports, proxy statements and other reports and information statements with the SEC. You may read and copy any of the materials that we have filed with the SEC at the SEC’s Public Reference Room at 100 F Street NE, Washington, DC 20549. You may obtain information about the Public Reference Room by calling the SEC at 1-800-SEC-0330. Our filings are also available to you on the SEC’s website at www.sec.gov.
In its own words, from its 10-K, filed Feb 25, 2026.
Rush Enterprises against its Retail-Auto Dealers & Gasoline Stations peers
The largest companies of the same SEC industry, each at its latest quarter. Revenue growth: +12% against the peers' median +12%. Operating margin: 5.1% against the peers' median 4.2%.
| Company | Quarter | Revenue | Y/Y | Op. margin |
|---|---|---|---|---|
| RUSHA Rush Enterprises | Q3 2026 | $2.1B | +12% | 5.1% |
| LAD Lithia Motors | Q3 2026 | $9.9B | +3% | 4.2% |
| PAG Penske Automotive Group | Q3 2026 | $8.4B | +4% | 3.6% |
| CVNA Carvana | Q3 2026 | $8.0B | +42% | 8.9% |
| KMX CarMax | Q2 FY27 | $7.9B | +20% | 2.8% |
| AN Autonation | Q3 2026 | $7.0B | -0.4% | 4.5% |
| MUSA Murphy USA | Q3 2026 | $6.9B | +35% | 3.8% |
| CASY Caseys General Stores | Q1 FY27 | $5.7B | +24% | 6.1% |
| GPI Group 1 Automotive | Q3 2026 | $5.4B | -7% | 3.7% |
Source: Rush Enterprises 10-Q on SEC EDGAR · CIK 1012019 · Retail-Auto Dealers & Gasoline Stations
Guidance and outlook
13F: who owns RUSHA and who is buying
More on RUSHA
History
Every quarter: Q3 2026 results · Q2 2026 results · Q1 2026 results · Q4 2025 results · Q3 2025 results · Q2 2025 results · Q1 2025 results